EcoWatch for Windows
Section 4
YSI Incorporated
Drinking Water Monitoring Systems Operation Manual
4-11
4.2.5
4.2.5
4.2.5
4.2.5 GRAPH
GRAPH
GRAPH
GRAPH DATA IN REAL TIME
DATA IN REAL TIME
DATA IN REAL TIME
DATA IN REAL TIME
Choosing the
New
command from the
Real-time
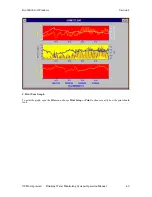
menu will bring up a window with graphs that plot data
from the sonde as the measurements are being taken. If you do not have a default COM port set in the
Communications Settings
dialog, then you will be asked which COM port to use for the real-time
measurements. If you do have a default port selected, then the program will use that port automatically.
The number of parameters displayed during real-time is set by the sonde. If four parameters are set in the
Report setup in the sonde, then those same parameters will be displayed in real-time. If you want to change
the parameters displayed, then you must close the real-time window, open a sonde terminal window,
change the number of parameters in the sonde software menu, and then return to real-time measurements.
The
Settings
command in the
Real-time
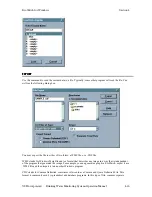
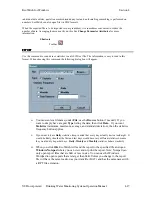
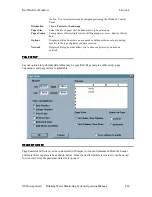
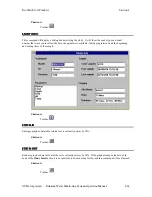
menu takes you to a dialog where you can set the x-axis time and
the sample interval.

