VEGAPULS 56K
53
Set-up
User programmable linearisation curves
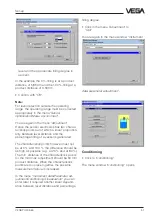
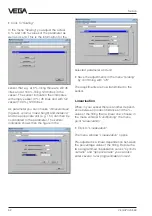
• To enter an own vessel geometry or a user
programmable filling curve, click to "
user
programmable curve“.
• Click to "
Edit“.
In the field "
Transfer measured value“ the
present level distance in percent is indicated of
the adjusted meas. window. You have adjusted
the meas. window during the min./max. adjust-
ment. In our example the meas. window is in the
range of 0,3␣ …␣ 5,85␣ m.
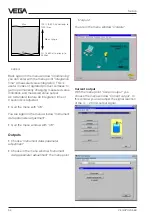
The user programmable linearisation curve is
generated with index markers of the value
pairs "
Linearised“ (level distance or adjusted
meas. unit) and "
Percentage value“ (percent-
age value of the filling). If the index markers or
value pairs of your vessel are not known to
you, you have to gauge the vessel by litres.
Gauging by litres
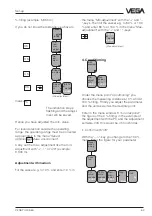
In the characteristics of the example you see
four index markers or value pairs. There is
always a linear interpolation between the index
markers.
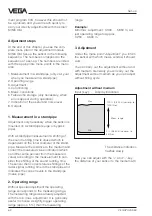
Click to "
Show scaled values“, to have to ad-
justed meas. unit displayed on the y-axis (bot-
tom left in the menu window).
Index marker 1 is at 0 % filling (percentage
value [%]), corresponding to an actual dis-
tance to the product surface of 5,850 m in the
example (empty vessel). The volume value is
hence 45 litres (rest filling of the vessel).
Index marker 2 is at a filling level of 30 %
(30 % of the measuring distance of
0,3␣ m␣ …␣ 5,85␣ m). In our example there are at
30 % filling 576 litres in the vessel.
Index marker 3 is at a filling level of 60 %. At
this filling level there are 646 litres in the ves-
sel.
Index marker 4 is at a filling level of 100 %
(product distance 0,300 m) at which 1200
litres are in the vessel.
You can adjust max. 32 index markers (value
pairs).
• Quit the menu with "
OK“.
• Confirm the message with "
OK“, and your
individual linearisation curve is saved in the


