


Chapter 4: Parametric Graphing
92
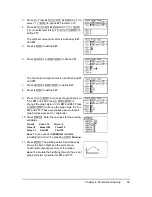
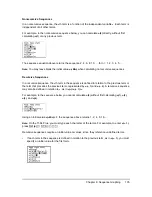
3. Press
o
. Press
30
„ ™
25
y ;
1
(to
select
¡
)
¤ Í
to define
X1T
in terms of
T
.
4. Press
30
„ ˜
25
y ;
1
¤ ¹
t
^
1
(to select
n/d
)
9.8
~
2
~
„ ¡ Í
to
define
Y1T
.
The vertical component vector is defined by
X2T
and
Y2T
.
5. Press
0
Í
to define
X2T
.
6. Press
t a † Í
Í
to define
Y2T
.
The horizontal component vector is defined by
X3T
and
Y3T
.
7. Press
t a Í
Í
to define
X3T
.
8. Press
0
Í
to define
Y3T
.
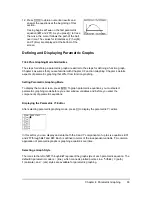
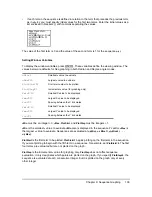
9. Press
|
|
}
Í
to change the graph style to
è
for
X3T
and
Y3T
. Press
}
Í
Í
to
change the graph style to
ë
for
X2T
and
Y2T
. Press
}
Í
Í
to change the graph style to
ë
for
X1T
and
Y1T
. (These keystrokes assume that all
graph styles were set to
ç
originally.)
10. Press
p
. Enter these values for the window
variables.
Tmin=0 Xmin=
L
10 Ymin=
L
5
Tmax=5 Xmax=100 Ymax=15
Tstep=.1 Xscl=50 Yscl=10
Note
: You can check all
WINDOW
variables,
including
@
X and
@
Y by pressing
1:Window
.
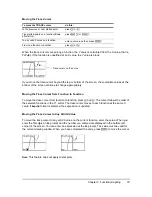
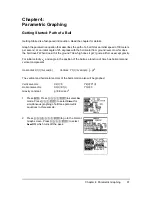
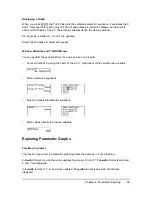
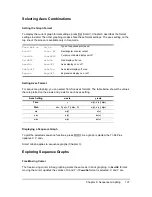
11. Press
s
. The plotting action simultaneously
shows the ball in flight and the vertical and
horizontal component vectors of the motion.
Note:
To simulate the ball flying through the air, set
graph style to
ì
(animate) for
X1T
and
Y1T
.


