Chapter 17: Activities
324
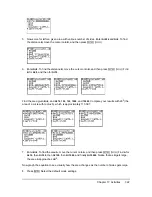
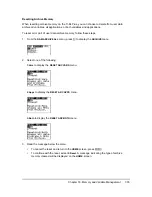
2. Press
Œ Í Í
to display the
TVM Solver
. Enter these values.
Note:
Enter a positive number (
800
) to show
PMT
as a cash inflow. Payment values will be
displayed as positive numbers on the graph. Enter
0
for
FV
, since the future value of a loan is 0
once it is paid in full. Enter
PMT: END
, since payment is due at the end of a period.
3. Move the cursor onto the
PV=
prompt, and then press
ƒ \
. The present value, or
mortgage amount, of the house is displayed at the
PV=
prompt.
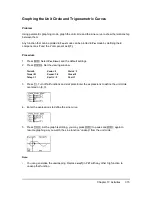
Now compare the graph of the amount of interest with the graph of the amount of principal for each
payment.
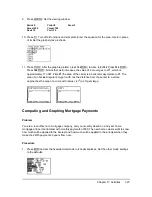
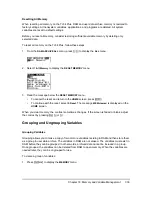
4. Press
z
. Set
Par
and
Simul
.
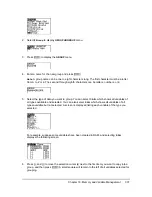
5. Press
o
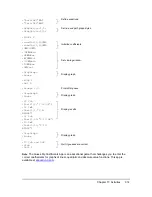
. Turn off all functions and stat plots. Enter these equations and set the graph styles
as shown.
Note:
G
Prn(
and
G
Int(
are located on the
FINANCE
menu (
APPS 1:FINANCE
).
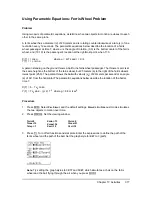
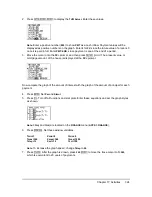
6. Press
p
. Set these window variables.
Note:
To increase the graph speed, change
Tstep
to
24
.
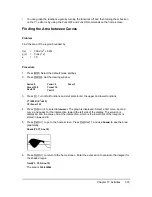
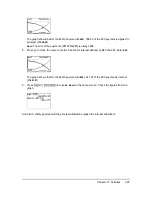
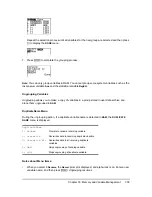
7. Press
r
. After the graph is drawn, press
240
Í
to move the trace cursor to
T=240
,
which is equivalent to 20 years of payments.
Tmin=1
Tmax=360
Tstep=12
Xmin=0
Xmax=360
Xscl=10
Ymin=0
Ymax=1000
Yscl=100

