Trace Comparison Display and Average Function
3- 192
WCA230A & WCA280A User Manual
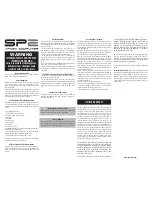
Max
Acquires the maximum value of data points
corresponding to each pixel.
Pixel data on screen
Acquired data points
Min
Acquires the minimum value of data points
corresponding to each pixel.
Pixel data on screen
Acquired data points
Pixel data on screen
Acquired data points
Max-Min
Acquires the minimum and maximum values of
data points corresponding to each pixel.
Figure 3- 133: Compression method for displaying the waveform
Summary of Contents for WCA200A
Page 6: ......
Page 8: ......
Page 29: ...Getting Started...
Page 30: ......
Page 57: ...Operating Basics...
Page 58: ......
Page 86: ...Functional Overview 2 28 WCA230A WCA280A User Manual...
Page 125: ...Reference...
Page 126: ......
Page 208: ...Modulation Analysis Demod Mode 3 82 WCA230A WCA280A User Manual...
Page 272: ...Setting Timing Parameters 3 146 WCA230A WCA280A User Manual...
Page 346: ...Display Line 3 220 WCA230A WCA280A User Manual...
Page 358: ...Marker Operation and Peak Search 3 232 WCA230A WCA280A User Manual...
Page 388: ...File Format 3 262 WCA230A WCA280A User Manual...
Page 392: ...Screen Copy 3 266 WCA230A WCA280A User Manual...
Page 393: ...Appendices...
Page 394: ......
Page 430: ...Appendix C Digital Demodulation Symbol Mapping C 4 WCA230A WCA280A User Manual...
Page 437: ...Glossary...
Page 438: ......
Page 446: ...Glossary Glossary 8 WCA230A WCA280A User Manual...
Page 447: ...Index...
Page 448: ......