99
the graphs has been maximized as the user does not have to return to the plate layout display
to re-select the data.
J.
Finish/save icons:
The results file can be saved at any point during the setup using typical
Windows commands.
However, if the padlock icon in the top-left of the Results Editor screen is locked,
the current file in use is designated
read only
. This provides a useful tool to protect
against the accidental over-writing of files meaning that if a file of the same name
exists in the destination folder, this file would have to be saved under a different
name. This function can be turned off by clicking on the padlock icon.
The user can also choose to save the experiment as just an experiment file i.e. minus the
results. On the
File
option on the menu bar, choose
Save as Experiment File
and the data will
be saved as a
.qexp
file into the default Experiment Library folder. If the padlock icon is locked
then the file cannot be given the same name as an existing file in the destination folder. Assign
a different name or ‘unlock’ the padlock by clicking the icon in the top-left of the Results Editor.
The user can finish the analysis at any time by selecting the
Finish
icon. If there have been
any changes made since the results file was last saved, the user will be prompted to save the
file.
3.7.3 Editing a graph
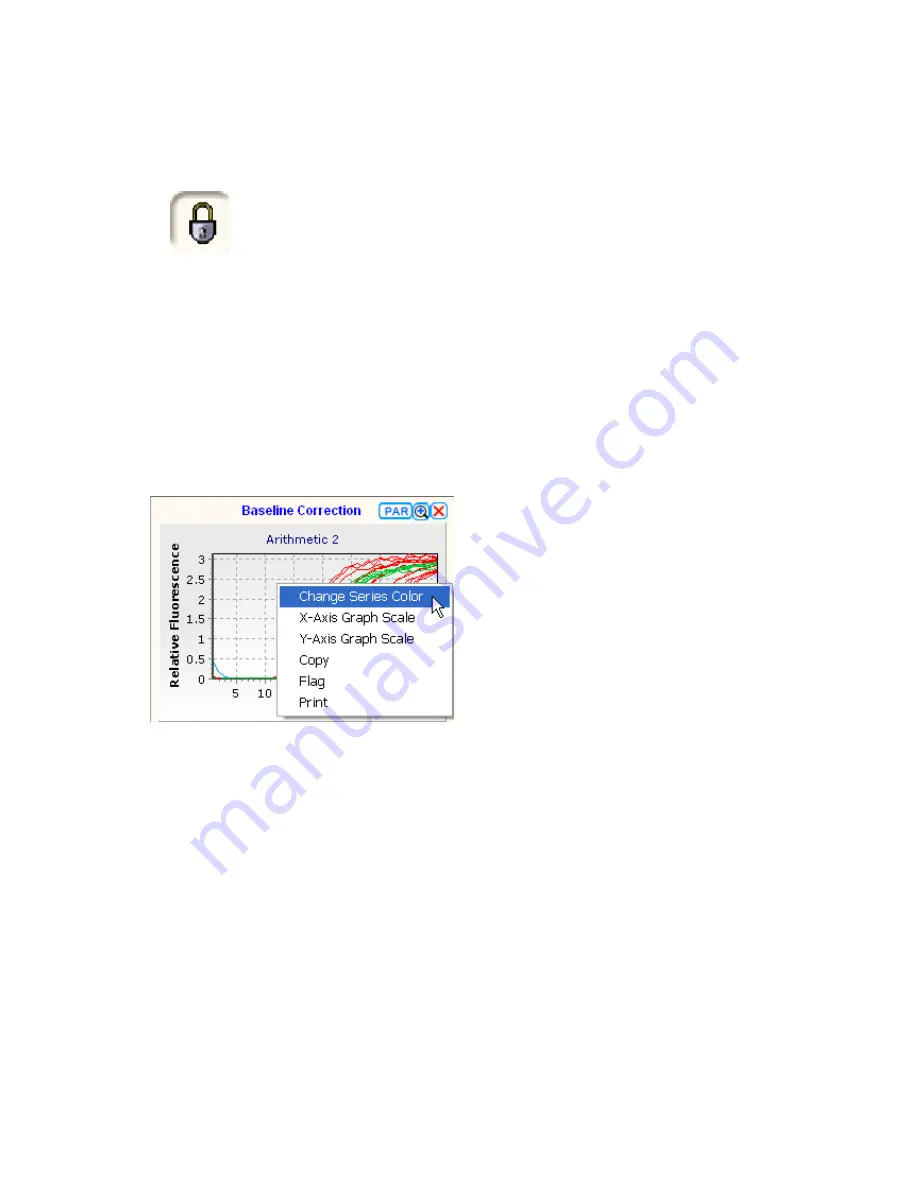
Simple changes to a graph can be made using the
right-click mouse
function while on the graph
of choice. This will bring up basic options for changing the appearance of a graph.
•
Change Series Colour:
A palette will appear allowing the user to change the colour of the
data points.
•
Graph scale:
Clicking will display the
Format Axis
settings box. This allows the user to
change the title and scale of the X- or Y-axes. Change as required and then press
Done
to
finish. This option can also be accessed direct from the menu bar – click on
Analysis
and
then
Graph Scale
…
•
Copy:
Copies the graph to the clipboard.
•
Flag:
Removes selected data from the graphical display and subsequent analysis.
•
Print:
Right click and select Print to print any graph.
Change the
Graph scale
as follows:
•
X- and Y-axis graph scale:
Clicking will display the
Format Axis
settings box. This allows
the user to change the titles and scales of either the X- or Y-axis.


