background image


33

1.16.2 

Filter cartridge care instructions 

  The filter cartridges must be handled with special care. 

  Only lift them from the foam in the box by the sides of the cartridges. 

  Avoid touching the filters. 

Loose  particles  should  be  removed  with  a  bulb  puffer  or  filtered,  pressurized  air  cleaner.    If 
necessary, gently wipe the surface using 100% alcohol and optical wipes; use a clean optical wipe 
each cleaning motion. 

1.16.3 

Filter cartridge installation 

The filter cartridges are positioned in a carousel with each cartridge having an identification label 
visible  from  the  access  door.  Installing  filter  cartridges  into  the  carousel  is  a  relatively  simple 
procedure that can be carried out by the user. 

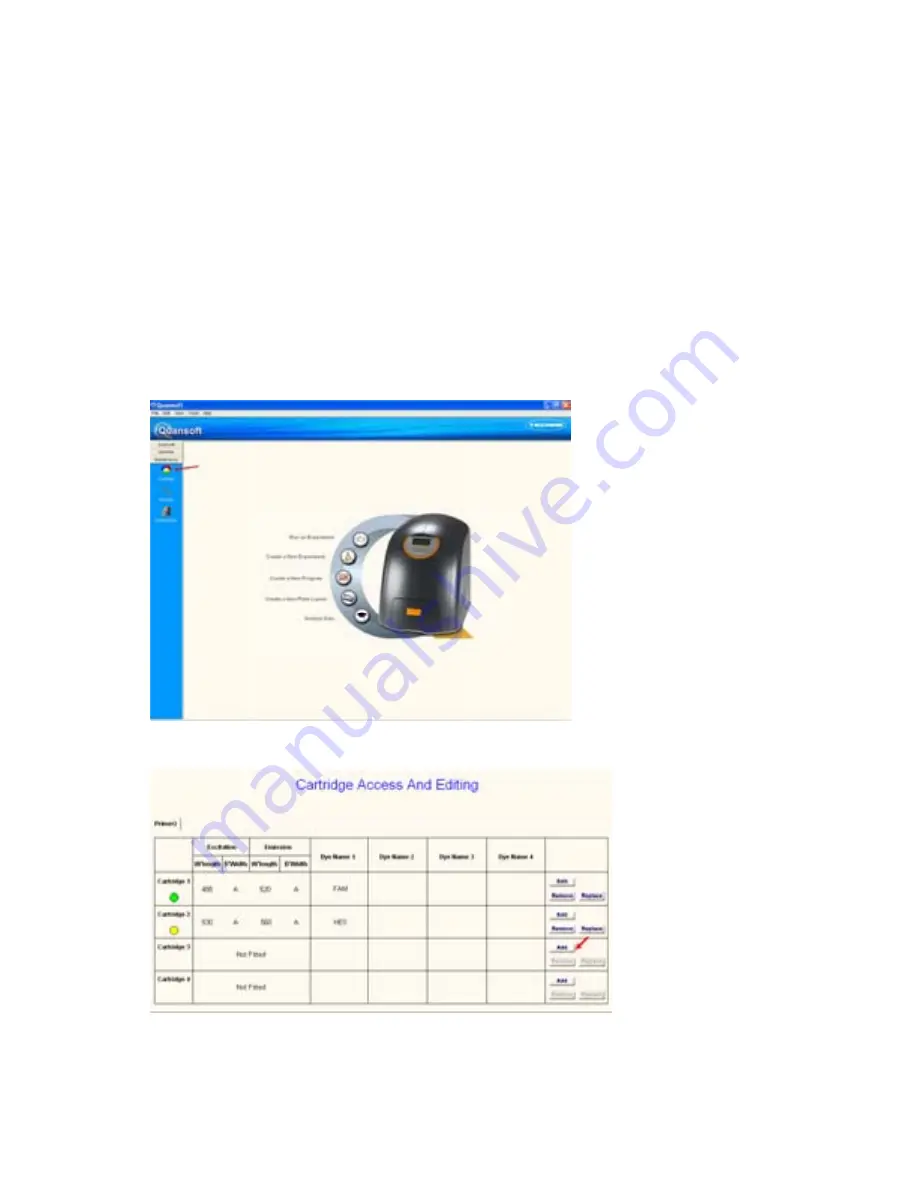
  In  Quansoft,  access  the  filter  settings  screen  by  clicking  on  the 

Cartridge

  icon  located  on 

the navigation bar of the Home Page (found under the 

Maintenance

 tab). 


This will bring up the 

Cartridge Access and Editing

 screen. An instrument must be connected for 

this screen to be displayed. 


Cartridge position:

 Colour-coded for ease of identification. 


Add/Remove/Edit/Replace:

 Launches a wizard which leads the user through the requested 

procedure. 

Summary of Contents for PrimeQ

Page 1: ...Version 2 1 08 12 PrimeQ OPERATOR S MANUAL...

Page 2: ...2...

Page 3: ...as a basic understanding of Laboratory techniques including assay design and preparation Microsoft Windows including terminology common commands file saving etc The guide is separated into the followi...

Page 4: ...4 Chapter 6 Troubleshooting and Glossary Identifying problems with the instrument and or the PCR Glossary of terms used in real time PCR...

Page 5: ...5...

Page 6: ...6...

Page 7: ...Installing the instrument 19 1 9 3 Operator safety 20 1 9 4 Installation 20 1 10 Before switching on 23 1 10 1 PrimeQ front view 23 1 10 2 Insert the block 23 1 10 3 Fuses 23 1 10 4 Connections on th...

Page 8: ...2 Running a plate 38 1 20 After use 39 2 Getting started 41 2 1 Introduction to PrimeQ 43 2 1 1 Principle of a real time PCR instrument 43 2 1 2 Principle of PrimeQ 43 2 1 3 Applications of PrimeQ 43...

Page 9: ...Starting the run 89 3 5 2 Monitoring the run 92 3 5 3 Stopping or pausing a run 94 3 6 LED intensity settings 95 3 7 Results Editor 96 3 7 1 Post run analysis main screen 96 3 7 2 Viewing the results...

Page 10: ...n 132 4 6 8 Quick guide to quantification analysis 137 4 7 Analysis method Dissociation curve 138 4 7 1 Assay requirements 139 4 7 2 Setup 139 4 7 3 Viewing the results 145 4 7 4 PrimeQ Report 146 4 7...

Page 11: ...k Access 174 5 3 User responsibilities 175 5 3 1 LED 175 5 3 2 Filters 175 5 3 3 Replacing the fuses 175 5 4 Consumables 175 5 5 Minimum computer requirements 176 5 6 Accessories 176 5 7 Replacement p...

Page 12: ...12...

Page 13: ...ovides information on general safety aspects definitions advice and instructions for unpacking and installing your instrument It also gives general information about the instrument and the control sof...

Page 14: ...14...

Page 15: ...py templates depending upon the assay 1 1 2 The thermal system 96 well low profile microplate format sealed with optical film Temperature controlled optical heated lid can be set between 100 C and 115...

Page 16: ...fy DNA down to single copy template or to achieve absolute quantification of 1 0nM fluorescein in a volume of 20 l 1 2 5 2 Dissociation analysis Using the easy to program ramp function PrimeQ will per...

Page 17: ...y scientific laboratory applications Aspects of the PCR process are claimed in U S Patent Nos 5 475 610 claims 160 163 and 167 and 6 703 236 claims 1 6 or corresponding claims in their non US counterp...

Page 18: ...en applied the wrong way the user is advised to send the heat sealer back to their supplier for repair Should the user want to attempt in house repair the heat sealer should be left to cool and the he...

Page 19: ...N SENSE 1 9 2 2 Aviso LAS TEMPERATURAS ELEVADAS SON PELIGROSAS pueden causarle graves quemaduras y provocar fuego en materiales combustibles Techne ha puesto gran cuidado en el dise o de estos aparato...

Page 20: ...a temperatura seg n sus necesidades En otros el sistema de desconexi n viene ya ajustado para evitar da os en el equipo En caso de que surgiera un problema de seguridad desconecte el equipo de la red...

Page 21: ...Linea Negro Neutro Blanco Tierra Verde El fusible 10A una vez instalado protege tanto al equipo como al usuario Los equipos funcionan a 100V y 230V La placa indicadora est situada en la parte posteri...

Page 22: ...i re de l appareil 3 Raccordez le c ble d alimentation la prise situ e l arri re de l appareil 4 Placez l appareil sur un plan de travail ou surface plane ou le cas ch ant dans une hotte d aspiration...

Page 23: ...one side always use both sides or support the block from underneath Ensure the block is fully engaged by pushing all four corners of the block down into the carrier Slide the quick release handles in...

Page 24: ...ket and connect the other end to your computer The lead must be less than 2 meters in length the lead supplied with the instrument is correct B Power switch C Fuses D Power connection Ensure that the...

Page 25: ...tor Photon counting photo multiplier tube PMT Multiplex Dye Detection Up to four dyes per reaction tube User Selected Filters Maximum of four paired excitation emission filter cartridges suitable for...

Page 26: ...range 5 C to 40 C Humidity Up to 80 relative humidity non condensing Notes The control specifications are quoted at an ambient temperature of 20 C The specification may deteriorate outside an ambient...

Page 27: ...ansit Returned goods will not be processed without a Returns Authorization Number Call the Service Department on 44 0 1785 810475 or 1 609 589 2560 in the US for a Returns Authorization Number Please...

Page 28: ...r tab and click on the Power button Activate the power scheme entitled Always On from the drop down menu and click Apply You may need to restart your computer 1 14 1 Set the decimal symbol to Before i...

Page 29: ...trol panel click on Add remove programs and then select Quansoft If upgrading from one release of Quansoft to another then the previous release should first be uninstalled as described Note the Releas...

Page 30: ...number Exit the registration procedure by pressing cancel and return when the unlock code has been returned by email 3 Phone Provide us with your details and registration number by telephoning 44 0 17...

Page 31: ...the run or pauses if already running Stop Stops the current run The screen will ask for confirmation of the stop command This button can be deactivated from Quansoft to guard against accidental stopp...

Page 32: ...t source enters the cartridge and is separated by the excitation filter 2 Light of the desired wavelength is then turned 90 by a dichroic mirror and directed to the wells via the fibre optic bundle 3...

Page 33: ...es are positioned in a carousel with each cartridge having an identification label visible from the access door Installing filter cartridges into the carousel is a relatively simple procedure that can...

Page 34: ...become the filter ID such that the fluorophores are viewed or chosen by the dye name e g FAM or Cy5 The input table can hold details for the four filter positions of the carousel Click Next A screen a...

Page 35: ...ridge by name or by wavelength Simply click the Select by Name Wavelength button to select which filter to use 1 16 6 Editing filter descriptions Clicking the Edit button in the Cartridge Access Editi...

Page 36: ...ually It is critically important that the correct excitation and emission filters are in the assigned position of the carousel During multiplexing you must choose two fluorophores with different excit...

Page 37: ...name has been changed you need to switch off the instrument before the new name can appear on the LCD screen and take effect The maintenance screen also gives instrument specific details including ser...

Page 38: ...liding it towards you To close the drawer push it home until the latch clicks and the drawer stays shut 1 19 1 Inserting a previously run plate Users should note that when the thermal cycler plates ar...

Page 39: ...ntamiento de muestras recuerde que las piezas del equipo tales como tubos bloques y dem s accesorios pueden estar muy calientes Tome las precauciones mencionadas anteriormente Apr s utilisation Lorsqu...

Page 40: ...40...

Page 41: ...AGGTTTACGCGAT GATTCCAAATGCGCTA 5 3 5 3 Forward primer Reverse primer AGCTTAGGCCTAACCG TCGAATCCGGATTGGCAGCTAAGGTTTCCAGATTCCAAATGCGCTA AGCTTAGGCCTAACCGTCGATTCCAAAGGTCTAAGGTTTACGCGAT GATTCCAAATGCGCTA 5 3...

Page 42: ...42...

Page 43: ...of multiplex experiments where multiple dyes are conveniently used within the same reaction The time taken for PrimeQ to read a plate can be adjusted by varying the integration time Read times can be...

Page 44: ...DNA using its 5 to 3 polymerase activity The optimal temperature for this enzyme is 72 C This results in the production of two new copies of the target DNA which assuming optimal conditions can be amp...

Page 45: ...nefits of this approach are its high sensitivity and wide dynamic range PrimeQ can measure to a sensitivity level of 1 0nM fluorescein and with a dynamic range of at least nine orders of magnitude End...

Page 46: ...hemistry is not open to multiplexing i e detection of multiple products Mode of action of SYBR Green I When the DNA strands are dissociated the dye does not bind or fluoresce SYBR Green I binds non sp...

Page 47: ...ns As with the hydrolysis probe technology molecular beacons use fluorophore quencher pairs in their mode of action When free in solution molecular beacons assume a hairpin structure that brings the e...

Page 48: ...then detects the emitted fluorescence at another Software The unit requires a PC installed with the application software Quansoft for protocols to be defined and downloaded and for the data to then be...

Page 49: ...spectra appropriate for the fluorophore being used The excitation filter transmits only those wavelengths of light that excite the fluorophore while the emission filter transmits only fluorescence pro...

Page 50: ...two basic components the heated lid and the X Y fibre optics Heated lid This component is made up of a heated glass plate that comes into contact with the top of the sample plate Designed with a spec...

Page 51: ...tting up and running of a real time PCR experiment Read the first section for an overview of Quansoft in general terms and a brief discussion of how the various parts fit together The next section hel...

Page 52: ...52...

Page 53: ...ers Plate layout thermal cycling program and analysis method parameters can all be conveniently accessed from the Home page with each Editor providing a flexible format and clear layout that makes vie...

Page 54: ...access into the experiment setup At the heart is the Experiment Editor whose role it is to act as a shopping cart for the plate layout and program elements The Experiment Editor also incorporates the...

Page 55: ...te layout and the analysis parameters It provides a summary of the setup thus acting as a gateway to browse create or edit elements of the experiment In essence the role of this editor is to simplify...

Page 56: ...Program Editor is the part of Quansoft where the user can define the temperatures hold times and reading parameters to be used in the PCR run The minimum requirement in order to start a run on PrimeQ...

Page 57: ...rameters 3 3 Using Quansoft 3 3 1 Home page The Quansoft Home page acts as a gateway to the software functions providing quick and easy links to both the Editors and their associated libraries Other f...

Page 58: ...access to the different editor libraries and the maintenance section of the software Home page icon Clicking the Home icon when in one of the libraries returns Quansoft back to the Home page Library i...

Page 59: ...iles Experiments qexp files and Results qres files The contents can be browsed and previewed in the pane in the lower half of the screen and by opening it up in the relevant editor either by double cl...

Page 60: ...to save the file under a new name The Open button allows the user to browse and select files from a library 3 3 5 Menu bar functions Quansoft s menu bar offers many of the functions found in a typica...

Page 61: ...ut the software including the version and serial number Registered users of Quansoft will be kept informed of software updates 3 3 6 Accessing the editors The user can access the Quansoft editors by t...

Page 62: ...s available from the Home page START 1 Choose to set up an entirely new experiment in the Experiment Editor browse or edit previously saved plate layout or program templates or else access the Plate L...

Page 63: ...rm three important functions Define a program Define a plate layout Define an analysis method Note only the setting of a program is essential for a run to be performed plate layout and analysis method...

Page 64: ...top left area of the Experiment Editor main screen There are three ways to define a PCR program Click this button when the program is to be defined entirely from new Click Browse to search the Program...

Page 65: ...clear view of the overall protocol Temperature profile Provides a summary plot showing the temperature profile for each cycle of the stage or the complete program when viewing at the Program level Cli...

Page 66: ...ifferent plate colour Sample Volume Default 20 l Change as appropriate max 50 l min 15 l Final Hold Default OFF Activate by clicking Set time and temperature as appropriate 3 4 3 4 Program A program i...

Page 67: ...om 100 C to 115 C Number of Cycles Define how many times the stage should cycle range between 1 and 99 Do Not Pause Default ON If a pause is required after this stage then click on this button To dele...

Page 68: ...cycle is required such as long template PCR Max Heating Rate Allows the heating rate to be set between 0 1 C sec and 2 2 C sec Note If any special parameters are selected including Inc Dec Temp or Inc...

Page 69: ...ad is to be added up to four dye reads can be added per step click here and repeat the process choosing the filters appropriate to the second dye The reads will be tabbed at the top of the settings bo...

Page 70: ...After Stage If set to pause the run will pause after each stage click to change to Do Not Pause Number of Reads Displays the number of readings programmed for the ramp maximum of 4 Number of Steps Di...

Page 71: ...times read points filters etc can be edited at any point prior to the run Click on Save to save the program to the Program Library Click Done to complete the program and return to the Experiment Edito...

Page 72: ...through to the Program Editor Define the thermal cycling parameters the filter cartridge settings and the read points as detailed in section 3 4 3 The program must be saved to the Program Library to...

Page 73: ...ing within the Program Editor as shown in section 3 4 3 7 or accessing the library folders from the quick links on the navigation bar of the Home page detailed in section 3 3 3 The destination of all...

Page 74: ...riment Editor with a blank plate layout template Run information Add a user name and any comments as appropriate Sample types Shows the active sample types in use No Template Control NTC Standard STD...

Page 75: ...on series use serial dilutions no more than one order of magnitude apart 1 10 1 100 etc Unknown UNK Samples containing an unknown quantity of the template being reported No template control NTC Simila...

Page 76: ...g up the Sample Types box this can also be accessed from the menu bar by clicking Tools Define Sample Types To add a sample type to the Active list simply highlight the sample type required from the A...

Page 77: ...numerical order unless otherwise specified 3 4 4 6 Assigning sample types to wells Click on a sample type icon for instance the UNK icon and the icon will become highlighted to show it is active Clic...

Page 78: ...plate of any assigned sample types Undo Cancels the previous operation Rotate plate 180 Useful if the plate was loaded into the instrument the opposite way round to the designated layout These functio...

Page 79: ...e red STD sample icon above the plate layout When only the selected well information is being shown the function button will now display Select All Wells Click on this button to return to displaying t...

Page 80: ...the Well Information table and press Ctrl V to import the data Sample information can also be directly imported from a txt file On the Menu bar click on File then Import from file Browse the file dire...

Page 81: ...ent Editor and the edited plate layout will appear in the Plate Layout pane 3 4 4 11 Create a new plate layout from the Home page Clicking on Create a New Plate Layout from the Home Page provides a qu...

Page 82: ...ing within the Plate Layout Editor as shown in section 3 4 4 9 or accessing the library folders from the quick links on the navigation bar of the Home page detailed in section 3 3 3 The destination of...

Page 83: ...since stages without reads have no data to analyse Analysis wizards Analysis can either be performed automatically using a series of default settings or set and edited using the intuitive wizard func...

Page 84: ...ethod chosen and closes the Wizard Reset defaults Pressing this button returns all analysis parameter settings to the default Back Next Allows the user to move between screens in the Analysis Wizard T...

Page 85: ...iment is not a template from a previous run then dyes cannot be assigned until an instrument is connected Click Next to move through to the Analysis Wizard specific to the analysis method chosen 3 4 5...

Page 86: ...can be useful for correcting the data prior to performing an analysis and so helping to increase the accuracy of the assay See Chapter 4 for more details Click Next 4 Set the analysis parameters Sele...

Page 87: ...e will appear asking if the file should be over written The qexp file will automatically be saved to the directory My Documents Quansoft Experiments Change the destination by browsing the file directo...

Page 88: ...alter readings and so forth or delete the current template and import another from the library files Analysis Either double click the name or highlight and press Edit Make any changes in the same way...

Page 89: ...xperiment Click on Create a New Experiment from the Home Page and set up a new experiment as detailed in section 3 4 2 Run an existing experiment Choose Run an Experiment from the Home Page and browse...

Page 90: ...nder Tools on the Experiment Editor menu bar Note running to report is only possible where the analysis type can use the default parameters or user defined settings and does not require user intervent...

Page 91: ...required The file will automatically be saved to the directory My Documents Quansoft Results but the destination can be changed by browsing the file directory shown in the Save in drop down menu A fin...

Page 92: ...ported via the display screen on the front of the instrument Cycle cc mm Reflects the current cycle number out of the total number for that stage eg 7 33 is the 7th cycle out of 33 This re sets after...

Page 93: ...l cycles in the run The red line shows the temperature profile while the coloured circles are the dye reading points more than one dye is represented by different colours as defined during the program...

Page 94: ...up to that point 10 Cycles Adds 10 cycles to the current stage and is useful if the PCR is progressing slower than expected Skip to Next Skips the remainder of the current stage and starts the next st...

Page 95: ...on the raw data plot of the Run Screen or Results Editor are above 100 000 counts using the Medium LED setting it is recommended that the Low setting be used for the assay instead Similarly if there...

Page 96: ...View to open the Program within the Program Editor The program will appear as it did on setup the only difference being that the user cannot edit or change any settings B Plate layout pane Appears as...

Page 97: ...s details of the run useful for GLP purposes see section 3 7 5 while the Report tab displays the information sent to the PrimeQ report see section 3 7 6 C Combine replicates Clicking this button combi...

Page 98: ...for each analysis method can be found in Chapter 4 The icons found at the top right of each graph allow the user to Maximize a pane the graph will fill half the screen so aiding visibility Minimize a...

Page 99: ...rent name or unlock the padlock by clicking the icon in the top left of the Results Editor The user can finish the analysis at any time by selecting the Finish icon If there have been any changes made...

Page 100: ...ost important features is the Export tab which enables the user to export the graphs in different file formats 3 7 4 Changing the analysis parameters A flexible approach to data analysis is provided w...

Page 101: ...djacent graph s 3 7 4 2 Change the analysis method An entirely different analysis method can be chosen or existing parameters edited from the Analysis Selection box found on the Results Editor main pa...

Page 102: ...e been selected Scroll through the pages using the reverse and forward arrows above the page Print using the Print Report icon Go to first page previous page Go to next page go to last page 3 7 6 Repo...

Page 103: ...buttons Frequently used functions are found on the Task bar Show current page number out of total Go to first page previous page Go to next page go to last page Export to pdf The report options can e...

Page 104: ...lick on the file and it will open straight up into the appropriate program If transferring multiple files then a file compression program such as WinZip will be useful To export a file simply highligh...

Page 105: ...e readings from different dyes o Click on Copy to copy the data to the clipboard The data can then be pasted into Excel 3 8 2 Printing The PrimeQ Report can be printed simply by selecting the Print op...

Page 106: ...106...

Page 107: ...le to users of PrimeQ Following a brief introduction providing a reminder of the theory behind real time PCR data collection the chapter goes on to discuss each analysis in more detail including setup...

Page 108: ...108...

Page 109: ...n be detected above the noise Growth phase exponential The most useful data occurs during the cycles where readings are above the noise and increasing in an exponential fashion The phase is characteri...

Page 110: ...on a log scale vs cycle number with the two cursors placed in the appropriate positions a blue line showing the noise threshold and a red the crossing line The quantification cycle is then calculated...

Page 111: ...hereby E 10 1 slope A reaction of 100 efficiency would produce a value of 2 such that a doubling of an amplification product occurs each cycle If the value is greater than 2 it suggests amplification...

Page 112: ...erature slowly ramps upwards the fluorescence will drop more rapidly as the reaction reaches the melting point and the dye can no longer intercalate Pure homogenous PCR products will produce a single...

Page 113: ...DNA strands dissociate i e the melting temperature or Tm Since the melting temperature is characteristic of the GC content length and sequence of a DNA product this method is a useful tool in product...

Page 114: ...s valid for the method see above table If multiple dyes are to be corrected differently within a stage then this must be performed post run Data can be re analysed an unlimited number of times simply...

Page 115: ...s how far the run has progressed When the run has completed results can be viewed in the Results Editor with data from each stage of the run located under its own tab Click on the appropriate tab to v...

Page 116: ...116 4 3 2 PrimeQ Report The PrimeQ Report shows the plate layout and raw fluorescence data with the default run details displayed by scrolling down the screen See section 3 7 6...

Page 117: ...is method will include options for PRD correction Clicking on the PAR button of the Raw Data graph brings up the PRD correction options The user can choose to display the raw data for the reporter the...

Page 118: ...wizard will ask if the data is to be PRD corrected Raw data for Reporter with or without PRD correction None No baseline correction Arithmetic 1 1 For each well calculate average of readings in range...

Page 119: ...ed number of highest readings is averaged to create a maximum All remaining data is scaled between the two on a percentage basis The default method is Arithmetic 2 with a default value of n 5 or 1 if...

Page 120: ...Editor main page or Results Editor if post run To change any settings simply click Edit to re enter the wizard 4 5 3 Viewing the results During the run the real time collection of data can be monitor...

Page 121: ...e recalculated and the graphs and results table updated accordingly The settings or analysis method can also be changed by accessing the Analysis Selection box from the Results Editor main page If a P...

Page 122: ...r Results Editor Analysis Selection box highlight the stage on which baseline correction is to be performed and click Edit 2 In the Analysis Wizard Selection box choose Baseline from the drop down men...

Page 123: ...elative quantification methods This method allows baseline correction for amplification data followed by a quantification calculation using one of two methods Results can then be given as a quantifica...

Page 124: ...f unknowns The Cq calculation screen provides two options for Cq calculation Fit points Default option Involves setting a noise and crossing threshold Useful for quantifying low copy number targets Fi...

Page 125: ...hown as orange points above the crossing line If necessary the user may manually slide the cursors to positions better suiting the data The user only has to choose where to place the cursors which are...

Page 126: ...tings or Cancel to abort the procedure Click Finish to complete the setup Fluorescent data for number of fit points above crossing line 1 Software calculates a best fit log linear fluorescence curve t...

Page 127: ...progressed When the run has completed results can be viewed in the Results Editor with data from each stage of the run located under its own tab 4 6 3 1 Viewing and changing the analysis parameters C...

Page 128: ...ions relevant for each stage Change as appropriate and click Done to finish 4 6 5 Using Cq values Cq values can be used in a number of different ways Plot the Cqs of standards against log concentratio...

Page 129: ...k the Cq icon if the quantification cycle graph is not displayed The results with or without correction are plotted on a scale of log fluorescence vs cycle number Although some fluorescence values may...

Page 130: ...n comparing two reporters in one well it is important for both PCRs to have a near equal efficiency typically in the range of 1 95 and 2 05 If there is more than one reporter dye with standards for ex...

Page 131: ...ained for all replicates of a sample Cq Quantification cycle for sample Avg Cq Mean Cq obtained for all replicates of a sample Units Unit of concentration Comments User inputted text y 3 402x 43 278 R...

Page 132: ...s the value relative to the calibrator provides the necessary information Setup procedure In the Analysis Wizard select Quantification as the analysis method and assign reporters note two reporters mu...

Page 133: ...d results can be viewed in the Results Editor with data from each stage of the run located under its own tab The Results Editor will display relative quantification data consisting of the plate layout...

Page 134: ...uantification cycles The relative Cq method allows the user to perform relative quantification without using a standard curve Instead the Cq of an unknown sample is normalized to a known sample e g a...

Page 135: ...REF If a calibrator sample is present then assign this sample as a CAL sample type in the plate layout Calculate Cq Cq Cq sample Cq calibrator Calculate 2 Cq This value represents the amount of target...

Page 136: ...eline corrected graph if chosen in the setup in addition to the quantification cycles graph for the individual dyes Column headings No Well number Well ID Location of well Sample ID User supplied or d...

Page 137: ...the noise threshold crossing line and number of fit points Click Next 6 Report options select which results should appear in the report Click Next 7 Summary of analysis Click Finish to return to the E...

Page 138: ...alysis the reaction is at a relatively low temperature and the fluorescence signal high As the temperature slowly ramps upwards the fluorescence will drop more rapidly as the reaction reaches the melt...

Page 139: ...ckground correction Corrects for effects of temperature on fluorescence and the background before and after all the DNA has melted Digital filter Smoothes the dissociation curve raw data but does not...

Page 140: ...ints on which to smooth the data in the drop down box The smoothing is for display purposes only subsequent calculations use only the raw data Background correction Select this option to correct the d...

Page 141: ...icking Next from the background correction screen leads to the peak detection options Principle The plot of dissociation peaks involves a calculation that takes the negative of the rate of change in f...

Page 142: ...hreshold value to limit the size of the peaks detected see below The default is 5 Once the data has been collected the specific number of cursors will be present on the dissociation peak graph in the...

Page 143: ...e of the peaks detected peaks smaller than the specified threshold relative to the tallest peak are not recorded For example if a well s largest peak has a height of 1000 on the dissociation peak grap...

Page 144: ...may overlap In this case the space between should be shared equally so overlap no longer occurs e g if there is a cursor of 80 C and one at 81 C and the validity range is 1 5 C then cursor 1 should h...

Page 145: ...appears in the PrimeQ report Click Next to view a Summary of the setup Click Back to change any settings or Cancel to abort the procedure Click Finish to complete the set up 4 7 3 Viewing the results...

Page 146: ...The report options can be changed from within the report tab of the Results Editor Click on the Report Options icon which will bring up the Report Options box Tabs will display the report options rel...

Page 147: ...ld filter for automatic detection or the bin threshold and threshold filter for manual detection Click Next Peak area Check the box to have peak area calculated from the data Click Next Report options...

Page 148: ...yse the raw data or baseline corrected data to measure the difference in fluorescence between the unknown samples and NTC 4 8 1 Assay requirements Need at least one reporter dye Need at least one read...

Page 149: ...Averages a user specified number of last readings the default is 5 or 1 if there are less than 5 readings Specify range Specify a range of readings to be averaged that best suit the data the default...

Page 150: ...Click Back to change any settings or Cancel to abort the procedure Click Finish to complete the set up 4 8 3 Viewing the results During the run the real time collection of data can be monitored on the...

Page 151: ...r The user is able to drag either threshold using the mouse thereby including or rejecting individual samples Results table Each sample is categorized in the results table as positive negative or unde...

Page 152: ...lick the raw data graph icon 4 8 4 PrimeQ Report The report options can be changed from within the report tab of the Results Editor Click on the Report Options icon which will bring up the Report Opti...

Page 153: ...cify a range of readings if necessary Click Next 6 Set upper and lower confidence thresholds Click Next 7 Report options Decide how to display the data in the PrimeQ report Plus minus score table is t...

Page 154: ...e is placed in the centre of the probe it has the maximum effect on the probe template stability Thermodynamically it is far more favourable for only the matching probe to bind to the template than th...

Page 155: ...The purpose of this part of the analysis setup is to define which readings should be used for allele scoring The options displayed are the same methods used as in plus minus scoring End point default...

Page 156: ...iew a Summary of the setup Click Back to change any settings or Cancel to abort the procedure Click Finish to complete the set up 4 9 3 Viewing the results During the run the real time collection of d...

Page 157: ...ter graph shows the fluorescence values of each reporter in a given well plotted against each other If the scatter graph is not displayed click on the icon to bring up the data To swap the axes over r...

Page 158: ...y box Select one of the coloured Type tiles in the Type box To assign a sample to that type either click on individual sample points or use the mouse to draw a box around the cluster To enhance visibi...

Page 159: ...tings for allelic discrimination setup If any settings are changed the data will be recalculated and the graphs and results table updated accordingly The settings or analysis method can also be change...

Page 160: ...le scoring method Click Next 5 Select which reporter to compare to which The fluorescence readings of the first reporter will be plotted against those of the second and displayed as a scatter graph Cl...

Page 161: ...RD correction to be enabled 4 10 2 Setup In the Analysis Selection box highlight the stage name for analysis to be applied and click Edit The Analysis Wizard will launch Choose Multi Read from the dro...

Page 162: ...Report Options and Summary Click Next to lead through to the Report Options screen This allows the user to choose whether to include the multi read table in the report Check the box to select Click N...

Page 163: ...gs for each well as colour coded points If the multi read graph is not displayed simply click on the Multi read icon to bring up the data Clicking a well s in the plate layout will highlight the selec...

Page 164: ...box from the Results Editor main page If a PRD was assigned in the dye usage box then the PRD correction options can be accessed by clicking on the PAR icon next to the raw data graph If the raw data...

Page 165: ...use next to the appropriate dye s name Click Next 3 Passive reference dye correction If a PRD was assigned in the dye usage screen options for correction will be displayed Click Next 4 Choose a Multi...

Page 166: ...amount of starting material is the same This approach requires the use of standards Allelic discrimination Capable of detecting single nucleotide differences this analysis method can only be used if t...

Page 167: ...ion etc 4 11 1 2 Viewing and changing the parameters Analysis settings can easily be changed post run which can be useful in multiplexing experiments if the user wishes to treat one reporter different...

Page 168: ...168...

Page 169: ...formation on PrimeQ About this chapter This chapter provides all the technical information you may need to know about your PrimeQ real time PCR system It covers everything from spare parts to recommen...

Page 170: ...170...

Page 171: ...of the case or cover should be immersed in the solvents Do not use aggressive solvents such as acetone or abrasive cleaners In the case of radioactive spillages Techne recommend that you use a proprie...

Page 172: ...bonado H galo con cuidado parae evitar que caiga agua dentro del mismo No utilice limpiadores abrasivos 2 Fusibles Su aparato est protegido por dos fusibles S lo deben cambiarlos personal debidamente...

Page 173: ...ar deux fusibles dont le remplacement ne peut tre effectu que par un personnel qualifi Si les fusibles sautent sans arr t il s agit d un probl me s rieux Nous vous conseillons dans ce cas de prendre c...

Page 174: ...lift or carry the block by one side only always use both sides or support the block from underneath When you have cleaned the block carefully place the block back in position Ensure the block is full...

Page 175: ...3 2 Filters The life of the emission and excitation filters is expected to be at least two years but is dependent upon the ambient temperature and humidity See chapter 1 for further details For part n...

Page 176: ...sound video and LAN facilities Internet Ethernet connection Software Internet Explorer Microsoft Office 5 6 Accessories The following accessories can be obtained from Techne or your Techne dealer Ple...

Page 177: ...with plug 1 7002705 US Power cord and 3 pin plug 120V 1 6501267 Fuse T5A 200V to 230V supplies 2 6500324 Fuse T10A 100V to 120V supplies 2 7002926 USB cable 1 PRIMEQ B Block 96 x 0 2ml well plate 1 51...

Page 178: ...e updated to display Not Fitted next to the slot from which the cartridge was removed Repeat for each filter cartridge until all have been removed Wrap each filter in the tissue paper and place in the...

Page 179: ...h the foam piece provided when the instrument is placed in the carton This prevents the drawer from moving against its latch during transit which could cause wear Pack the block and filters wedge the...

Page 180: ...us Techne takes no responsibility for returned goods damaged in transit If you do not have the original packing you can purchase a new pack from your dealer part number 5100492 5 9 1 Returns authoriz...

Page 181: ...ubleshooting Troubleshooting real time PCR and PrimeQ About this chapter This chapter contains information required for troubleshooting the real time PCR process the control software and the instrumen...

Page 182: ...182...

Page 183: ...n component missing always include a positive control Dye has been exposed to light and bleached Do not expose components containing a dye to light Do not freeze thaw repeatedly Wrong filter cartridge...

Page 184: ...ence Concentration of dye is too low either because the dye has deteriorated or insufficient was added to the reaction Protect reagents from light Do not freeze thaw repeatedly Check optimization of d...

Page 185: ...Restart instrument and computer Fatal error displayed on LCD screen Instrument error Note the error message and contact your Techne Distributor Any other error which prevents a PCR run being initiate...

Page 186: ...orescence increases past a fixed threshold PrimeQ has default values of 10 standard deviations above the noise for the threshold or Crossing Line Crossing Line The best fit or threshold significantly...

Page 187: ...elation coefficient which describes how well a line of Best Fit describes the relationship between two sets of data A value of close to 1 defines good correlation whilst a value of 0 defines no correl...

Reviews: