


Status
Pro
–
µLine F1 User Manual
39
PERFORMING MEASUREMENT
8.3 Assessing Data and Creating a Report
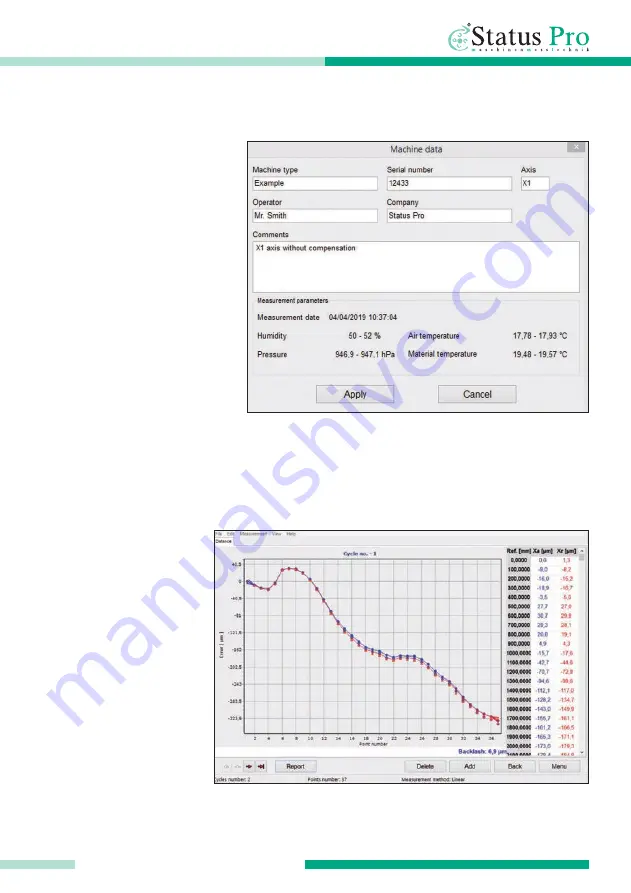
Measurement is visual-
ized by two graphs in red
and blue (see fig. 46).
Blue corresponds to the
primary route in mea-
surement, red its
inversed route. The value
in Y indicates the error in
absolute position for
every point. Under the
diagram to the bottom
right you can see the rel-
ative inversion measured
in blue.
Fig. 46: Example of data measured
8.2 Saving Data
Once measurement is com-
plete you should save the
results. Go to 'File' and 'Save
as' in the top task bar of the
program. Fig. 45 shows the
window in which you can enter
general details at the time of
measurement. Click apply,
choose where to save in the
pop up window and confirm
with 'save'. You can load this
file anytime by going to 'File'
and clicking 'Open' there.
Fig. 45: Save machine details and conditions in 'Machine Data'


