


22
SALICRU
Indicator
State
Description
Bypass
indicator
Steady green
Load supplied by bypass
Steady red
Bypass abnormal or out of normal range,
or static bypass switch fault
Flashing red
Bypass voltage abnormal
Off
Bypass normal
Inverter
indicator
Steady green
Load supplied by inverter
Flashing
green
Inverter on, start, synchronization or
standby (ECO mode) for at least one
module
Steady red
System output not supplied by inverter,
inverter fault for at least one module.
Flashing red
System output supplied by inverter,
inverter fault for at least one module.
Off
Inverter not operating for all modules
Load
indicator
Steady green
UPS output ON and normal
Steady red
UPS overload time is out, or output short,
or output no power supply
Flashing red
Overload output of UPS
Off
No output of UPS
Status
indicator
Steady green
Normal operation
Steady red
Failure
Tabla 13.
Status description of indicator
There are two different types of audible alarm during UPS op-
eration, as shown in Table 14.
Alarm
Description
Two short alarm with
a long one
when system has general alarm (for
example: AC fault),
Continuous alarm
When system has serious faults (for
example: fuse or hardware fault)
Table 14.
Description of audible alarm
7.4.2. Control and Operation Keys
The central touch screen has keys with different functionalities.
See Table 15 for the description of each one.
Function Key
Description
EPO
Long press, cut off the load power (shut down the rectifier,
inverter, static bypass and battery)
BYP
Long press, transfer to the bypass(Push the button up in
the back of the door to enable ,see Fig.5.2)
INV
Long press, transfer to the inverter
MUTE
Long press to switch between turning off and on the
buzzing
Table 15.
Functions of Control and operation keys
Attention:
When bypass frequency is over track, there is interruption
time(less than 10ms) for transferring from bypass to inverter.
7.4.3. LCD touch Screen
Users can easily browse the information, operate the UPS, and
reset the parameters through the LCD touch screen, which is
friendly for users.
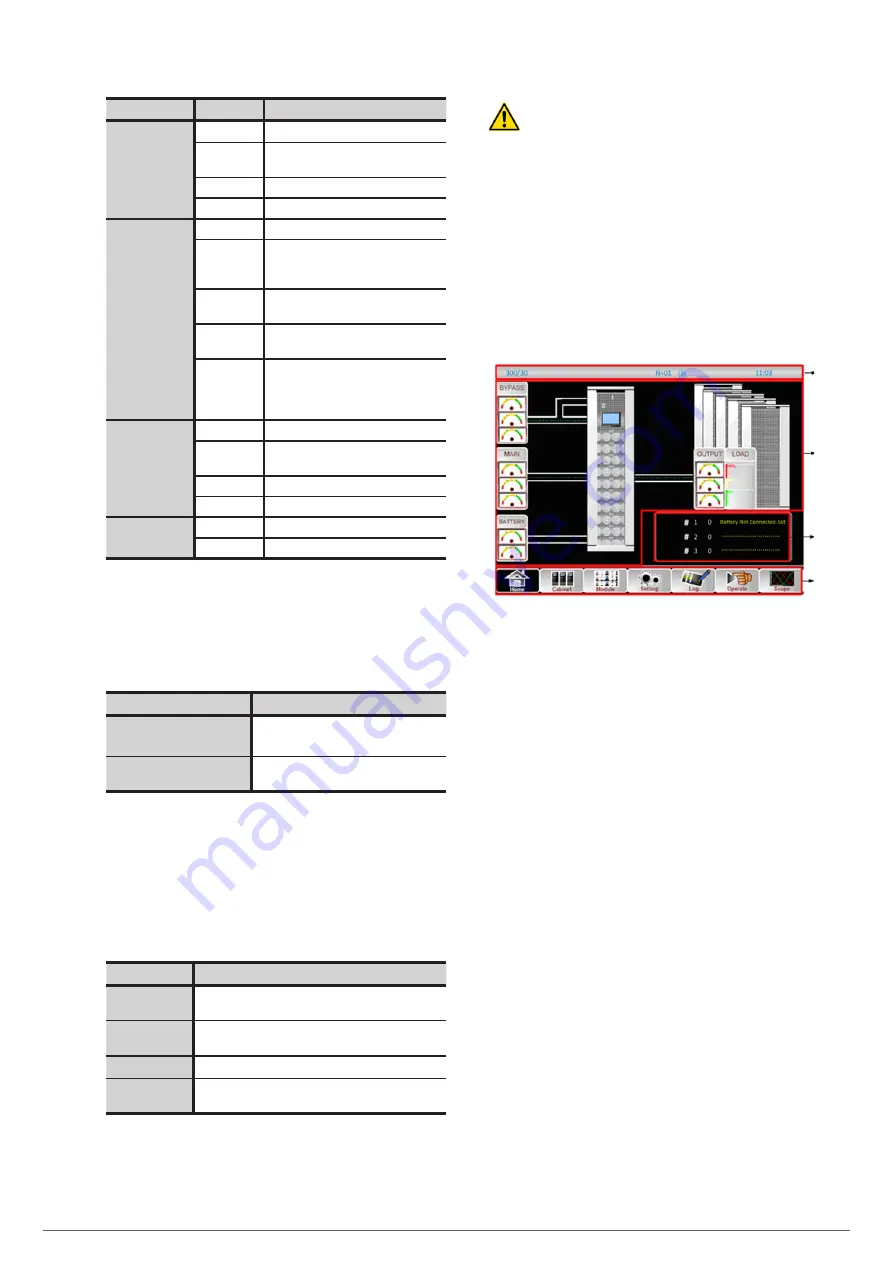
After the monitoring system starts self-test, the system enters
the home page, following the welcome window. The home
page is shown in Fig. 34.
1
2
3
4
1-Status bar
2: Warning Information
3: Information Display
4: Main Menu
Fig. 34.
Home page
•
Status bar
The Status bar contains the model of the product, capacity, op-
erational mode , and the number of the power module and the
time of the system.
•
Warning Information
Display the warning information of the cabinet.
•
Information Display
Users can check the information of the cabinet in this area.
The bypass voltage, main input voltage, battery voltage, and
output voltages are presented in the form of gauge.
The loads are displayed in the form of bar chart in percentage. The
green area stands for a load of less than 60%, yellow area for a
load of 60%-100% and red area for a load of more than 100%.
The energy flow mimics the flow of the power.