G A L A X Y ® A U R O U R A L S C O N F I G U R A T I O N A N D S Y S T E M I N T E G R A T I O N G U I D E
51
Section 3 Management
3.1.4
Scan / Performance Results
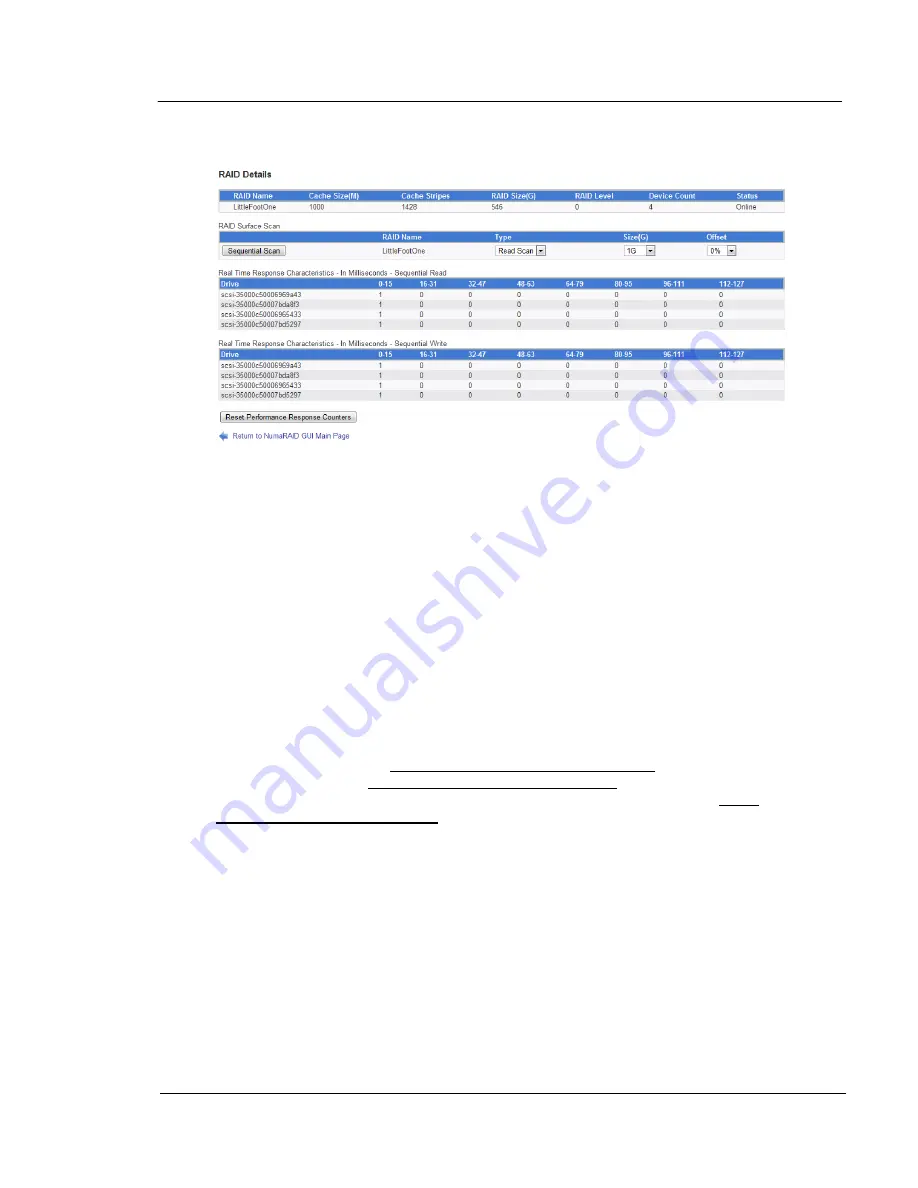
When you click the ‘Scan / See Performance Stats’ button on the RAID Details page, the
performance page opens as the example above shows.
This is a very important screen which can help troubleshoot problematic hard drives: At the
top, the RAID Details table shows the name of the selected RAID, the cache size (in
Megabytes), the number of cache stripes, the RAID size (in Gigabytes), the RAID Level (0 or
6), the device count (the number of devices which make up the RAID), and the overall RAID
status. RAID Surface scan will be discussed later.
Real Time Response times are displayed for Read and Write operations. Each drive belonging
to the RAID drive is shown with it's by-id device name. The upper table represents reads, the
lower table represents writes. The numbers at the top of the table columns are times in
milliseconds. For example, the first column indicates 0-15 milliseconds, the second indicates
16-31 milliseconds, and so forth. The numbers below are quantities of sectors. The numbers
reflected in the tables are either since the system was booted, or since the last time the tables
were reset. In the example above, the first drive has a 1 in the 0-15 column in the Read table.
This indicates that it has read 1 sector, and that it took between 0 and 15 milliseconds to read
that sector.
Below the two tables, is a Reset Performance Response Counters button, which is used to
reset the tables, and a Return to NumaRAID GUI Main Page link which returns to the Main
GUI Screen. It is ideal, that before you run the test, that you left-click on the Reset
Performance Response Counters button at the bottom, eliminating any accumulated numbers
from previous tests or normal array operations.


