G A L A X Y ® A U R O U R A L S C O N F I G U R A T I O N A N D S Y S T E M I N T E G R A T I O N G U I D E
55
Section 3 Management
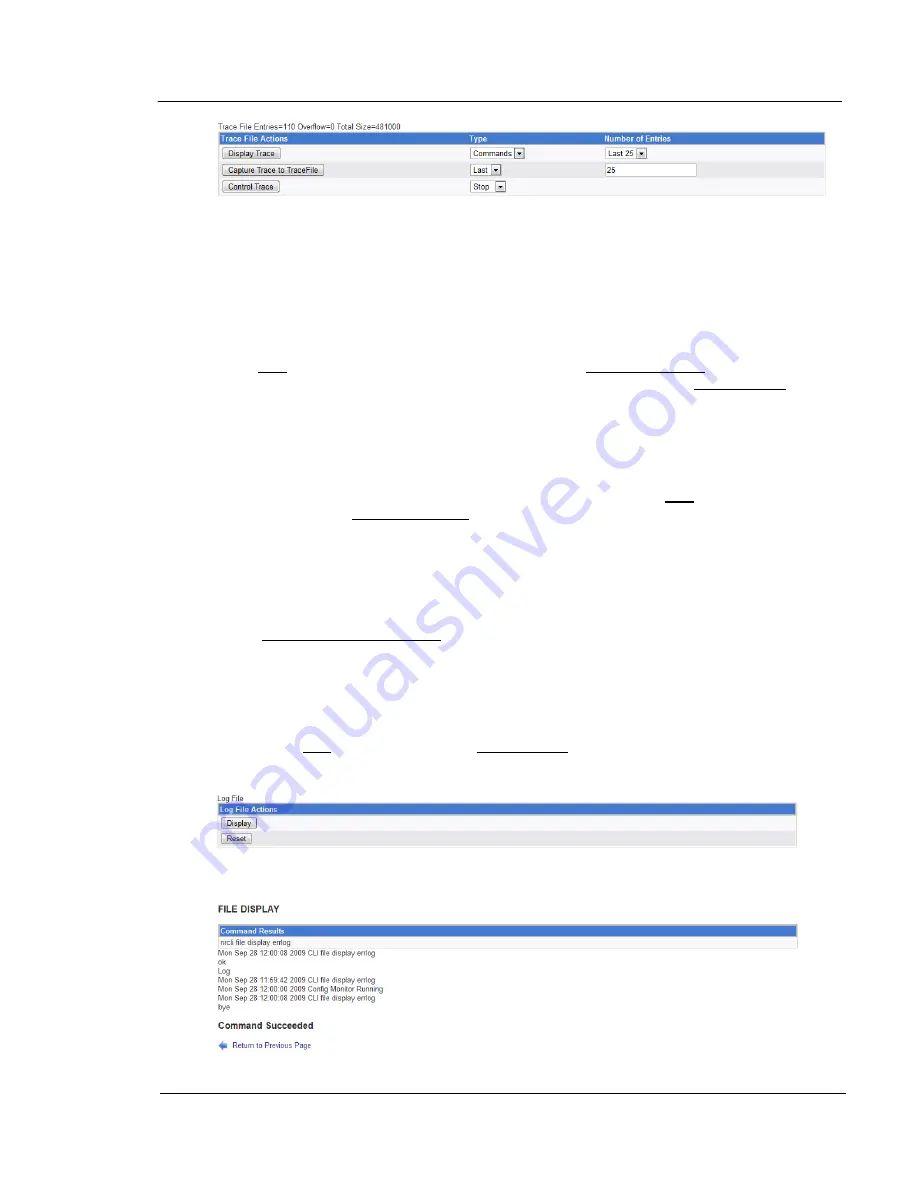
A trace file contains internal diagnostic information, which can be used by the programmers for
troubleshooting. Above the table is some information about the last/current trace. It shows the
number of entries in the trace file – in the example above, there are 110 records/entries. To
the right of this, it shows overflow. This indicates how many entries could not be recorded
because the file became too large. On the right is the current size of the trace file (in bytes). In
this example, it is 481000 bytes.
The ‘Display Trace’ function goes to a different screen (covered in the next section) for
displaying information from the trace. You have four options here – there are two options
under type (Commands and all), and two options under Number of entries (First 25 and Last
25). You can select only one option from each column, then left-click on Display Trace to go to
the screen to show the results of what you selected. Under type, Commands, displays only
commands, all displays commands and all other information recorded. For the number of
entries. Last 25 shows the information starting with the last 25 entries of the trace file. First 25
shows the information starting with the first 25 entries of the trace file.
The ‘Capture Trace to TraceFile’ records the data to a file. This is usually done to retain the
information from a trace prior to resetting/restarting a new one. The type function works in
conjunction with the number of entries function, creating something similar to the Number of
Entries function under display trace, but more flexible. You can specify “All” for type, then the
number in the Number of entries field is not used – this specifies dumping all of the trace file to
the data file. Otherwise you can specify First or Last, followed by the number in the next field,
indicating to dump that number of entries from the start or the last of that number of entries
perspectively. For example, specifying First under type, then 30 under Number of entries will
dump the first 30 entries to the file. Once you have made the settings that you want, left-click
on the Capture Trace to TraceFile button to capture the trace to a file.
The ‘Control Trace’ function controls the trace. The options which appear under type change,
depending on whether or not a trace is running. There’s three options: Start, Stop, or Reset.
Stop only appears if a trace is running, and is used to stop a trace. Start only appears if a
trace is not running, and is used to start a trace. Reset only appears if a trace is running, and
stops then restarts the trace in a single operation. To perform the desired action, select the
action under type, then left-click on the Control Trace button.
Below the Trace table is a Log File table as follows:
This is used to display or reset the NumaRAID log file. Resetting the log clears the log. Display
shows it. Here is a sample of what that might look like:


