3-32
hsb
2
Plus Series Fishfinders
M
ovin
g A
rou
nd
the
Ch
art
Radar/Chart Overlay
If radar data is available from another display connected on
hsb
2
, the radar
targets can be overlaid onto the full-screen chartplotter display. The radar/
chart overlay option helps you to distinguish between fixed, charted objects
and other objects that could be moving vessels. Some radar controls are
available in overlay mode.
The following criteria must be true for radar/chart overlay to function
correctly:
•
Position and heading data are provided so that vessel position and orienta-
tion can be determined.
•
The vessel must be displayed on screen.
•
The chartplotter must be in North Up or Course Up mode (see Section 7.7).
•
The chartplotter range must be between 1/4nm and 48nm (equivalent to a
radar range of 1/8nm to 24nm).
•
Custom range scales are disabled on the radar.
•
The radar must be transmitting.
To ensure the vessel remains on the screen, you could use Find Ship (see
Using
FIND SHIP
on
page 3-29
) to home the cursor onto the vessel.
When Radar/Chart overlay is switched on, the status bar indicates
OVL
. If the
option is switched on but the overlay is not visible (because one of the above
criteria has failed), the status bar indication changes to
(OVL)
.
When Radar/Chart overlay is switched on the soft key
MORE...
provides
access to the
SCREEN
soft key and to the radar controls
TARGETS
and
MARPA
.
The radar
GAIN
control is also active in overlay mode.
Note:
Radar/Chart overlay is displayed at the current chart range. You
should be aware that if radar is shown on any other display, its range will
match that displayed on Radar/Chart overlay. Conversely, if you change the
radar range on any display, the Radar/Chart overlay image will change to the
new radar range.
➤
To select radar/chart overlay:
1. Press the
DISPLAY
key to show the
DISPLAY
pop-up, then if necessary
press again to select Chart mode.
2. Press the
OVERLAY OFF ON
soft key to toggle the option on.
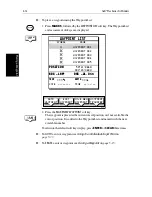
The two highest intensity radar returns are displayed in purple, over the chart
image. The radar image is translucent, so that chart text, contours and outlines
are visible beneath the radar targets.
Summary of Contents for hsb2 PLUS
Page 1: ...hsb2 PLUS Series Fishfinders Owner s Handbook Document number 81195_2 Date August 2002...
Page 2: ......
Page 34: ...1 22 hsb2 Plus Series Fishfinders Database Lists...
Page 64: ...2 30 hsb2 Plus Series Fishfinders Transmitted Data...
Page 110: ...4 14 hsb2 Plus Series Fishfinders MOB...
Page 160: ...5 50 hsb2 Plus Series Fishfinders Review Your Passage Plan...
Page 172: ...6 12 hsb2 Plus Series Fishfinders Data Log Mode...
Page 200: ...8 8 hsb2 Plus Series Fishfinders Worldwide Support...
Page 204: ...A 4 hsb2 Plus Series Fishfinders Appendix A Specifications...
Page 216: ...C 6 hsb2 Plus Series Fishfinders Appendix C C MAP Chart Card Features...
Page 228: ...viii hsb2 Plus Series Fishfinders...


