VIDEO VBOX LITE MANUAL
Page | 50
22 December 2009
3: Positioning the Bar
Once the background has been selected, the position of the Bar on the Bar Graph must be set and the attributes
which determine its behaviour, such as the colour, fill direction, parameter and minimum and maximum values used
also need to be defined.
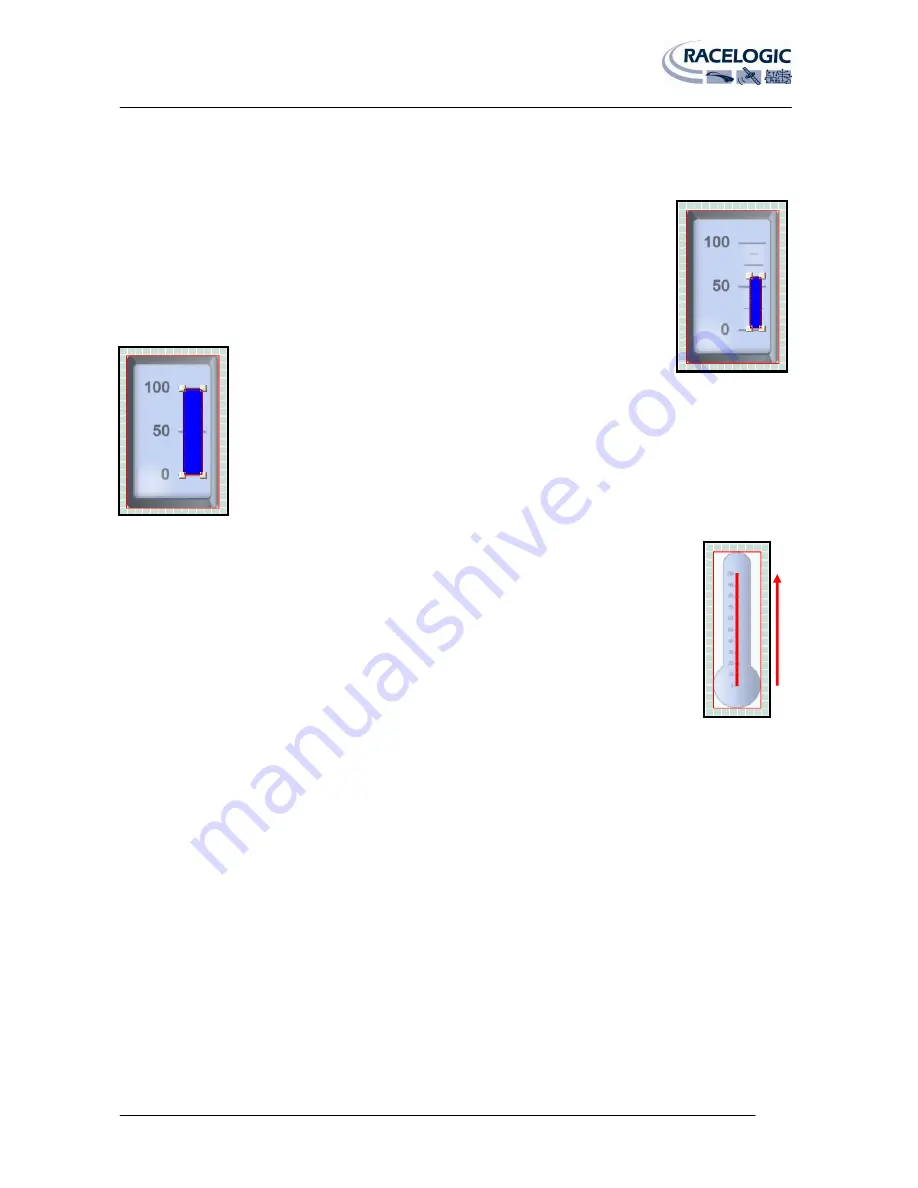
Click the Bar image to give it focus then click and drag it so that it is lined up with the marker
points on the background.
Now click on the corner block to drag the corner of the Bar and resize it to the required size and
shape. The block should fill the range required to represent the data.
4: Setting the Colour of the Bar
Clicking on the ‘Colour’ button brings up a colour palette allowing the user to customise the colour
of the bar.
5: Setting the Bar Fill Direction
The default setting for the Bar Fill Direction is left to right, for other Bar Graphs such as a
thermometer this will need to be changed to bottom to top. Clicking on the ‘Fill Direction’ drop
down menu allows the user to select between fill directions of left to right, right to left, bottom to
top, or top to bottom.
6: Setting the Range
Depending on what the Bar Graph will be used for the minimum and maximum range values need to be modified to
suit the needs of the user. Simply type the required min and max value is the Range text boxes in the properties
window.
NB:
The range values set in Element properties govern the range of values the bar graph will move through, it does
not change the values on the bar graph face. The gauge face is an image file, to modify the range values on the bar
graph it must be edited in the image editing package used to create it.
7: Choosing the Parameter
This selects the
parameter
to be displayed by the Bar Graph. If a CAN Database has been loaded into the software and
assigned to the software CAN channel the user also has the choice of selecting this CAN parameter.
NB:
See the ‘Logging CAN channel’ Section for more information


