4 Functionality
and
Time2
are normalised to the exposure time. They can be set to a maximum value of 1000,
which corresponds to the exposure time.
Examples in the following sections illustrate the LinLog
®
feature.
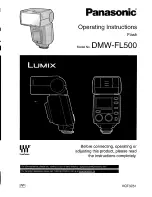
LinLog1
In the simplest way the pixels are operated with a constant LinLog
®
voltage which defines the
knee point of the transition.This procedure has the drawback that the linear response curve
changes directly to a logarithmic curve leading to a poor grey resolution in the logarithmic
region (see Fig. 4.12).
tt
V a l u e 1
t
e x p
0
V
L i n L o g
= V a l u e 2
T i m e 1 = T i m e 2 = m a x .
= 1 0 0 0
Figure 4.11: Constant LinLog voltage in the Linlog1 mode
0
50
100
150
200
250
300
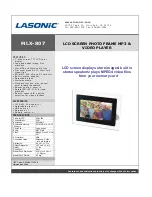
Typical LinLog1 Response Curve − Varying Parameter Value1
Illumination Intensity
Output grey level (8 bit) [DN]
V1 = 15
V1 = 16
V1 = 17
V1 = 18
V1 = 19
Time1=1000, Time2=1000, Value2=Value1
Figure 4.12: Response curve for different LinLog settings in LinLog1 mode
.
30
Summary of Contents for CameraLink MV1-D1312 series
Page 1: ...User Manual MV1 D1312 I CameraLink Series CMOS Area Scan Camera MAN041 09 2010 V2 5...
Page 2: ......
Page 4: ...2...
Page 8: ...CONTENTS 6...
Page 14: ...2 How to get started CameraLink 12...
Page 24: ...3 Product Specification 22...
Page 72: ...4 Functionality Figure 4 56 Unsharp Mask Examples 70...
Page 110: ...8 Mechanical and Optical Considerations 108...
Page 112: ...9 Warranty 110...
Page 114: ...10 References 112...
Page 118: ...A Pinouts 116...