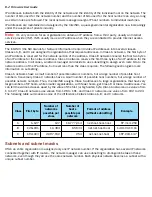
Utilities and Diagnostics 11-13
Select
T1 Line Statistics / Diagnostics
and press Return.
The T1 Line Statistics / Diagnostics screen appears.
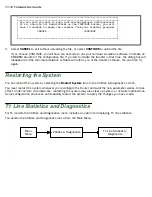
The screen displays the current condition of tests that you run. The counters display the occurrences of the
indicated events in fifteen-minute increments, shifting the totals to the column to the right after each fifteen
minute cycle until the total is accumulated in the
24 hours
column.
Condition:
Displays the parameters tested.
Time columns:
Current time (00:00) star ts at zero and resets to zero at 15:00 minutes, shifting the counted
total to the next column to its right.
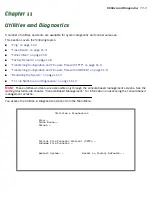
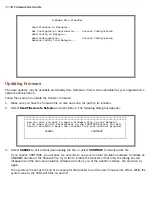
Utilities & Diagnostics
Ping...
Trace Route...
Telnet...
Trivial File Transfer Protocol (TFTP)...
X-Modem File Transfer...
Restart System... Revert to Factory Defaults...
T1 Line Statistics / Diagnostics...
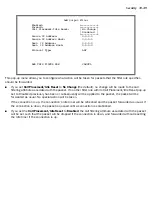
T1 Line Statistics / Diagnostics
--Condition------------------00:16---00:27---00:12----1:57----1:42---24 hours-
Errored Seconds 007 000 000 000 000 00000
Unavailable Seconds 006 000 000 000 000 00000
Severely Errored Seconds 016 000 000 000 000 00000
Bursty Errored Seconds 000 000 000 000 000 00000
Loss of Frame Count 000 000 000 000 000 00000
Bipolar Violation Count 000 000 000 000 000 00000
+-------------------------+
Line Status: +-------------------------+
Loopback Status: | Normal - Clear Loopback |esent
| Send Blue Alarm -all 1s |
| Remote Payload Loopback |
| Local Payload Loopback |
Tests... | Loopback Pattern Test |
+-------------------------+
Summary of Contents for 4000 Series
Page 10: ...x Firmware User Guide Packet header types B 14 Appendix C Binary Conversion Table C 1 Index ...
Page 18: ...1 8 Firmware User Guide ...
Page 66: ...2 48 Firmware User Guide ...
Page 102: ...3 36 Firmware User Guide ...
Page 130: ...4 28 Firmware User Guide ...
Page 206: ...7 18 Firmware User Guide ...
Page 224: ...9 14 Firmware User Guide ...
Page 274: ...10 50 Firmware User Guide ...
Page 314: ...Index 6 ...

