


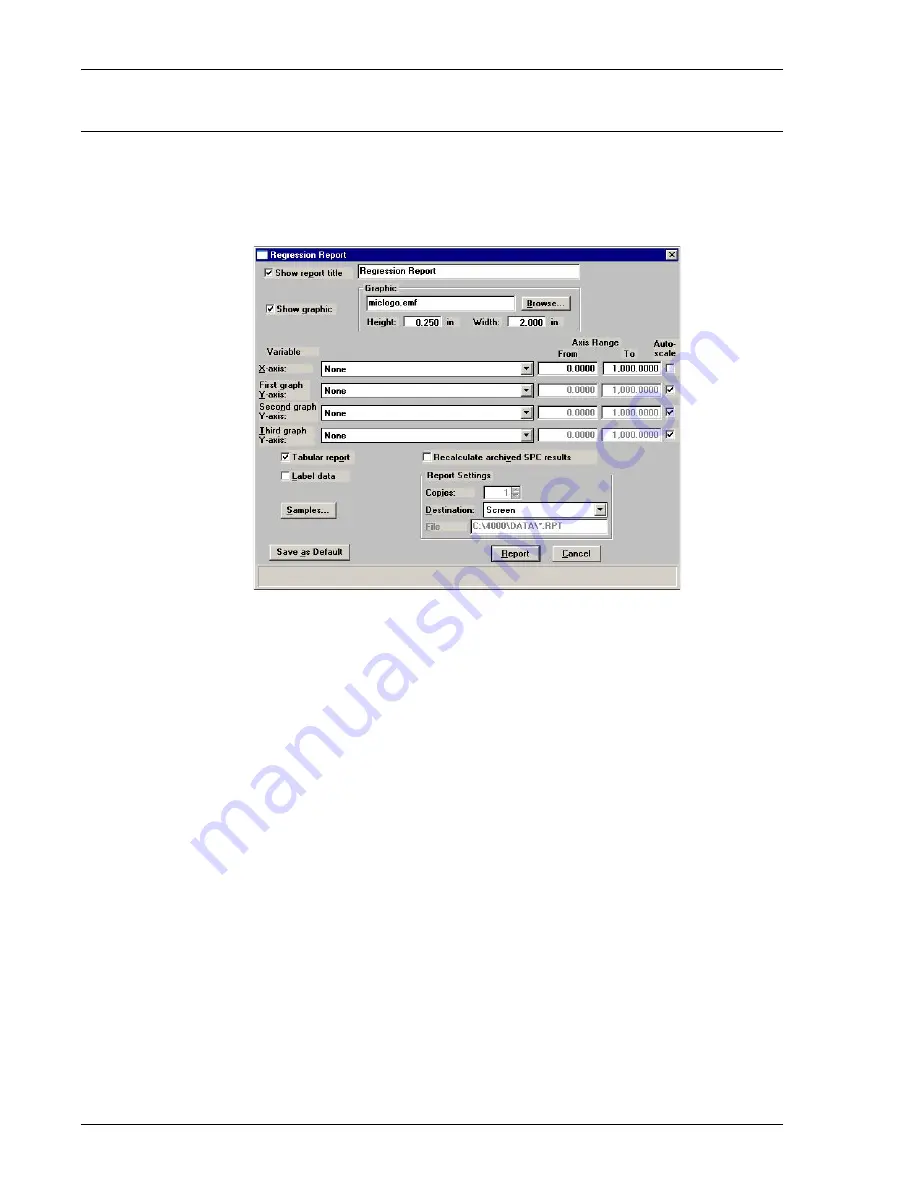
Regression Report
DVVA II 4000
7-6
400-42803-01 (Rev B) - July 2017
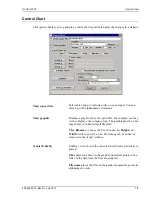
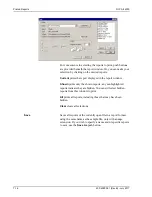
Regression Report
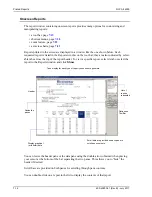
The regression report is used to determine the interdependency between two variables. Up to
three dependent variables (Y-axis) may be plotted against a single independent variable (X-
axis). The degree of correlation between the variables also is reported.
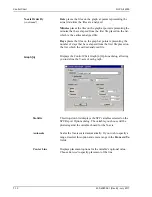
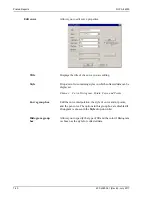
Show report title
Select this option to have a title display on your report. You can
enter up to 40 alphanumeric characters.
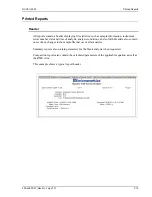
Show graphic
Displays a graphic above the report title. For example, you may
wish to display your company logo. The graphic must be a
bitmap (bmp) or enhanced metafile (emf).
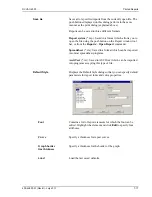
Click
Browse
to choose the file; use the
Height
and
Width
fields to specify a size. This image can be edited or removed in
the report window if printed to the screen.
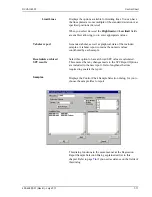
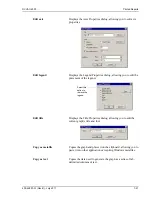
X- and Y-Axes
Variable fields
Allows you to designate the X- and Y-axes variables. Click on
the down arrow to display a list of variables. The variables in
this list are the ones you specified in the
SPC report options
.
With this option, you can plot the regression of up to three Y-
axis variables against the X-axis variable. The X-axis specifies
the independent variable for the regression, while the Y-axes
provide the dependent variables.
Summary of Contents for DVVA II 4000
Page 1: ...DVVA II 4000 Dynamic Void Volume Analyzer Operator s Manual Rev B 400 42803 01 July 2017 ...
Page 4: ......
Page 10: ...Table of Contents DV VA II 4000 vi 400 42803 01 Rev B July 2017 ...
Page 16: ......
Page 32: ......
Page 116: ......
Page 136: ......
Page 160: ......
Page 180: ......
Page 212: ......
Page 214: ......
Page 240: ......
Page 246: ......
Page 248: ......


