

Maintenance
DVVA II 4000
9-26
400-42803-01 (Rev B) - July 2017
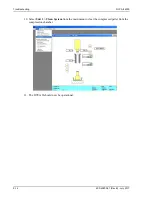
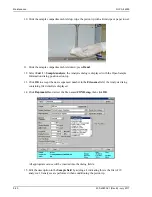
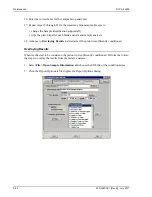
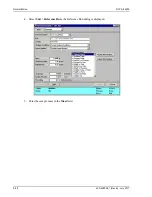
11. Click
OK
; the report window containing overlay results is displayed. Click the
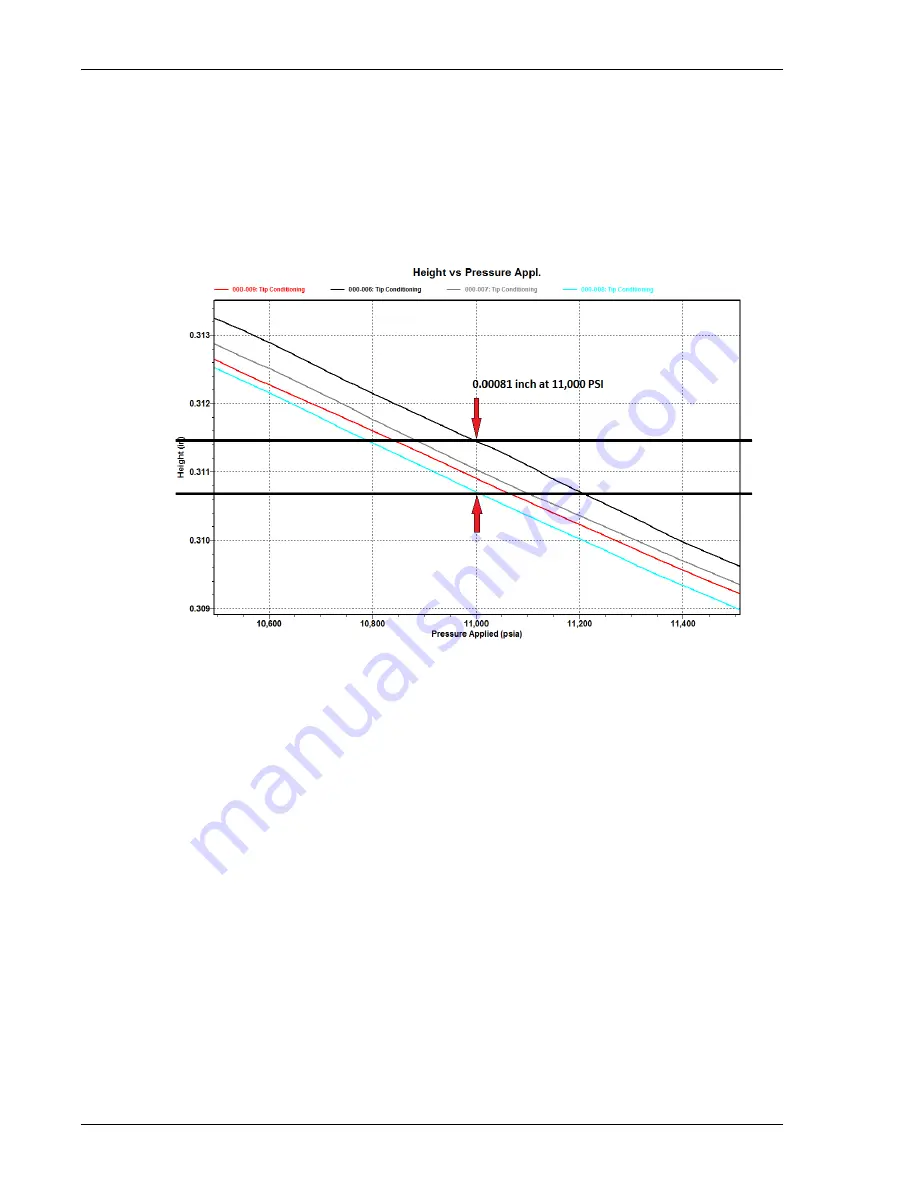
Height vs
Pressure
tab to display the data.
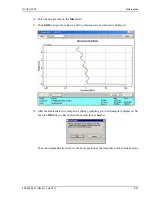
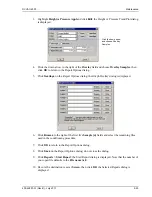
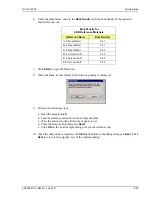
12. Right-click in the graph area and choose
Autoscale
from the shortcut menu.
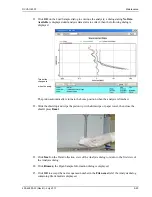
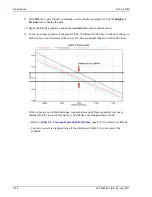
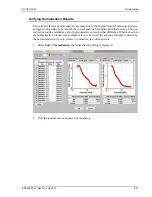
13. Zoom in on these portions of the graph: 5,000, 15,000 and 25,000 psi. Continue zooming on
each until you can determine if the curves for three sequential runs are within 0.001 inch.
If the curves are not within this range, repeat analyses until three sequential curves are
obtained. If after a total of 20 analyses you still have not obtained these results:
• Refer to
Table 9-1. Common Operational Problems
, page
9-1
for corrective solutions.
• Contact your service representative if the solutions in Table 9-1 do not correct the
problem.
Summary of Contents for DVVA II 4000
Page 1: ...DVVA II 4000 Dynamic Void Volume Analyzer Operator s Manual Rev B 400 42803 01 July 2017 ...
Page 4: ......
Page 10: ...Table of Contents DV VA II 4000 vi 400 42803 01 Rev B July 2017 ...
Page 16: ......
Page 32: ......
Page 116: ......
Page 136: ......
Page 160: ......
Page 180: ......
Page 212: ......
Page 214: ......
Page 240: ......
Page 246: ......
Page 248: ......


