R
EAL
T
IME
R
EPORTS
S
ECTION
C
HAPTER
4: A
NALYZE
U
SAGE
T
RENDS
806
M86 S
ECURITY
U
SER
G
UIDE
View Trend Charts
There are three basic types of trend charts that can be
generated on demand to show total gauge score averages
for a specified, limited time period:
•
Pie trend chart for an individual URL or bandwidth gauge
•
Pie trend chart for all collective URL or bandwidth
gauges
•
Line chart showing details for a pie chart
View activity for an individual gauge
To view activity for any individual URL or bandwidth gauge:
1. If the gauges dashboard does not currently display,
choose
Dashboard
from the Gauges menu in the navi-
gation toolbar.
2. Be sure the dashboard of your choice (URL or Bandwidth
gauges) displays. If not, click the URL or Bandwidth
button above the dashboard to display the dashboard of
your choice.
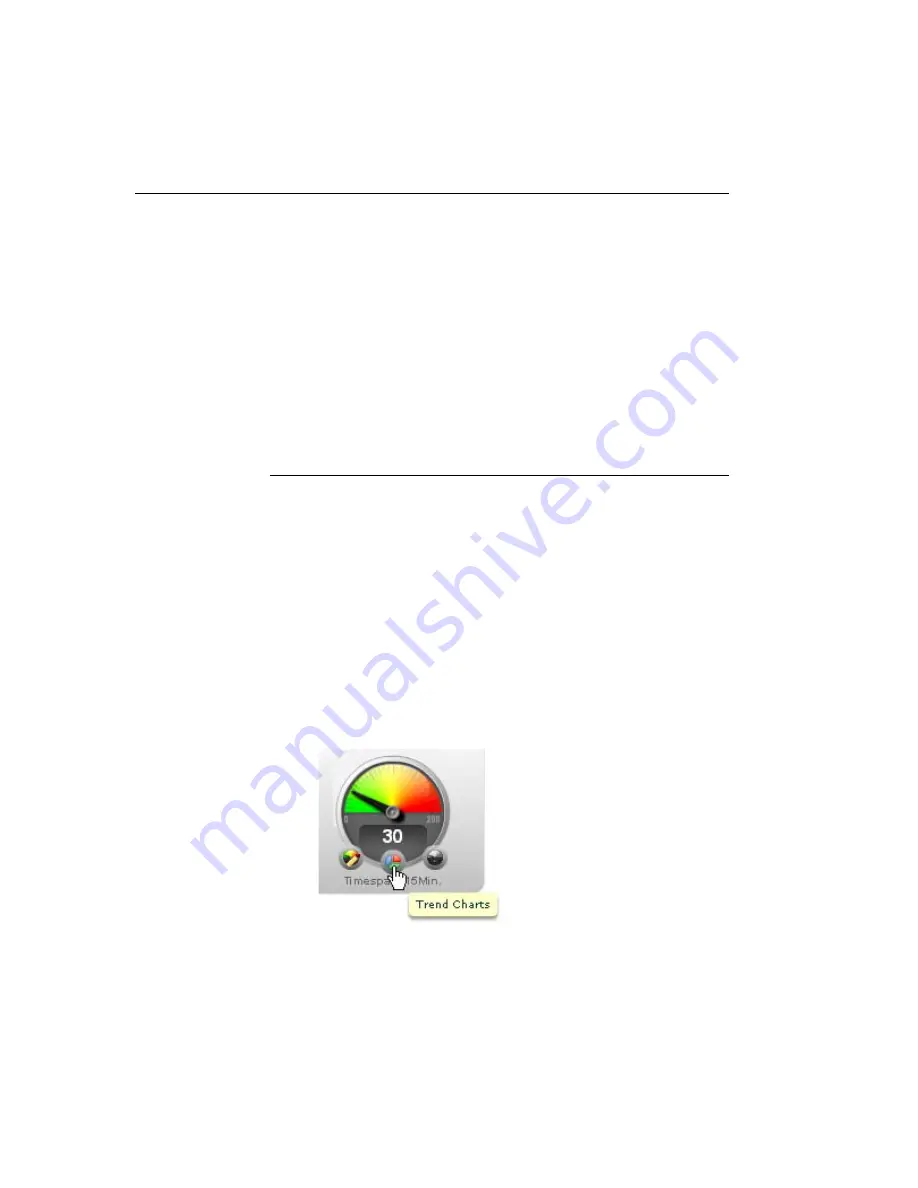
3. Find the gauge for which the trend chart will be gener-
ated, and then click the Trend Charts icon at the bottom
middle of that gauge:


