Chapter 10. Generating Reports
10.6
The Performance Analysis Screen
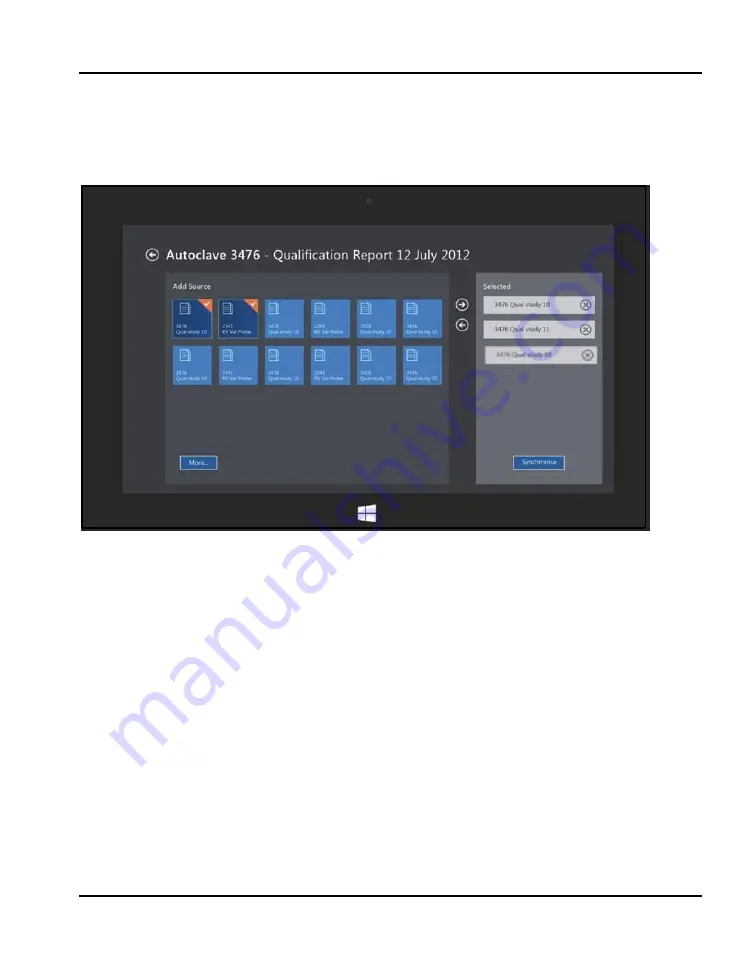
Figure 65: The Data Sources Screen
If you highlight a study file and touch the forward (right) arrow, the file moves to the right
panel, which displays the setup files selected for the report. (To remove the file from the
report, touch the backward (left) arrow.) The selected files are highlighted in a mix of dark
blue and orange on the left, while the unselected files appear in light blue. You can add up
to three qualification study files. (A warning appears if you try to add a fourth study.)
When you select two or three studies, the
Synchronise
button appears at the bottom of the
right panel. If you press
Synchronise
, the data of the merged files appears in graph form in
a sequence.
When you press
Data Sources
, the screen displays two panels. The left panel,
Add
Source
, displays up to 12 available study files, with a More button that displays all other
study files.
120
Kaye Validator User’s Manual
Summary of Contents for Validator AVS
Page 1: ...Validation Kaye Validator AVS User s Manual Kaye Validator User s Manual...
Page 2: ...Kaye Validator AVS Thermal Process Validation System User s Manual M5100 EN Rev A May 2015...
Page 3: ...No content intended for this page Kaye Validator User s Manual...
Page 133: ...Chapter 10 Generating Reports 126 Kaye Validator User s Manual...
Page 138: ...Chapter 10 Generating Reports Kaye Validator User s Manual 131...
Page 147: ...Chapter 10 Generating Reports 140 Kaye Validator User s Manual...
Page 167: ...No content intended for this page...


