Control
S. 63
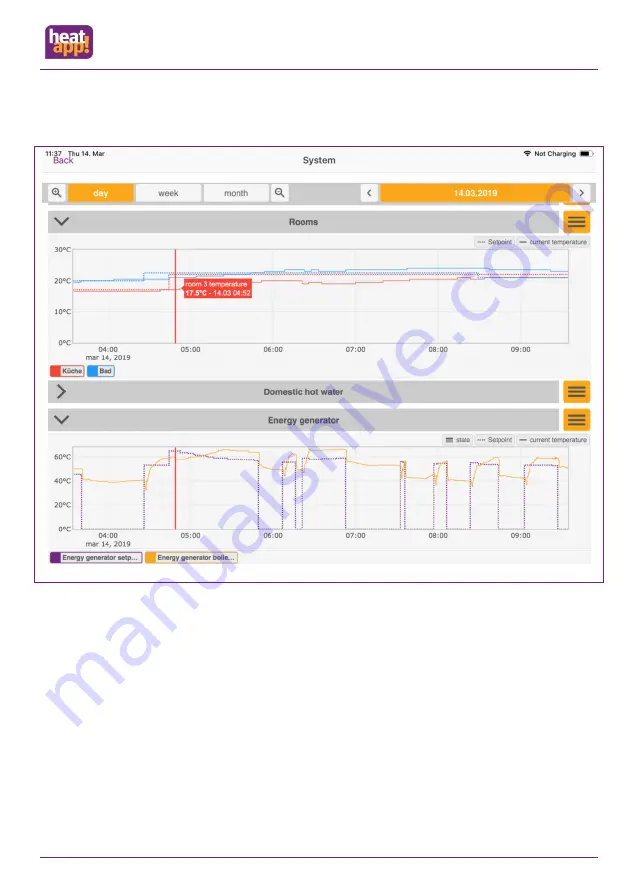
The red vertical line moves by double-clicking / tapping on the desired time. This allows the comparison of the individual graphs.
This makes it easy, for example, to find out where the request comes from.
Fig.: 41 Monitor as analytical tool


