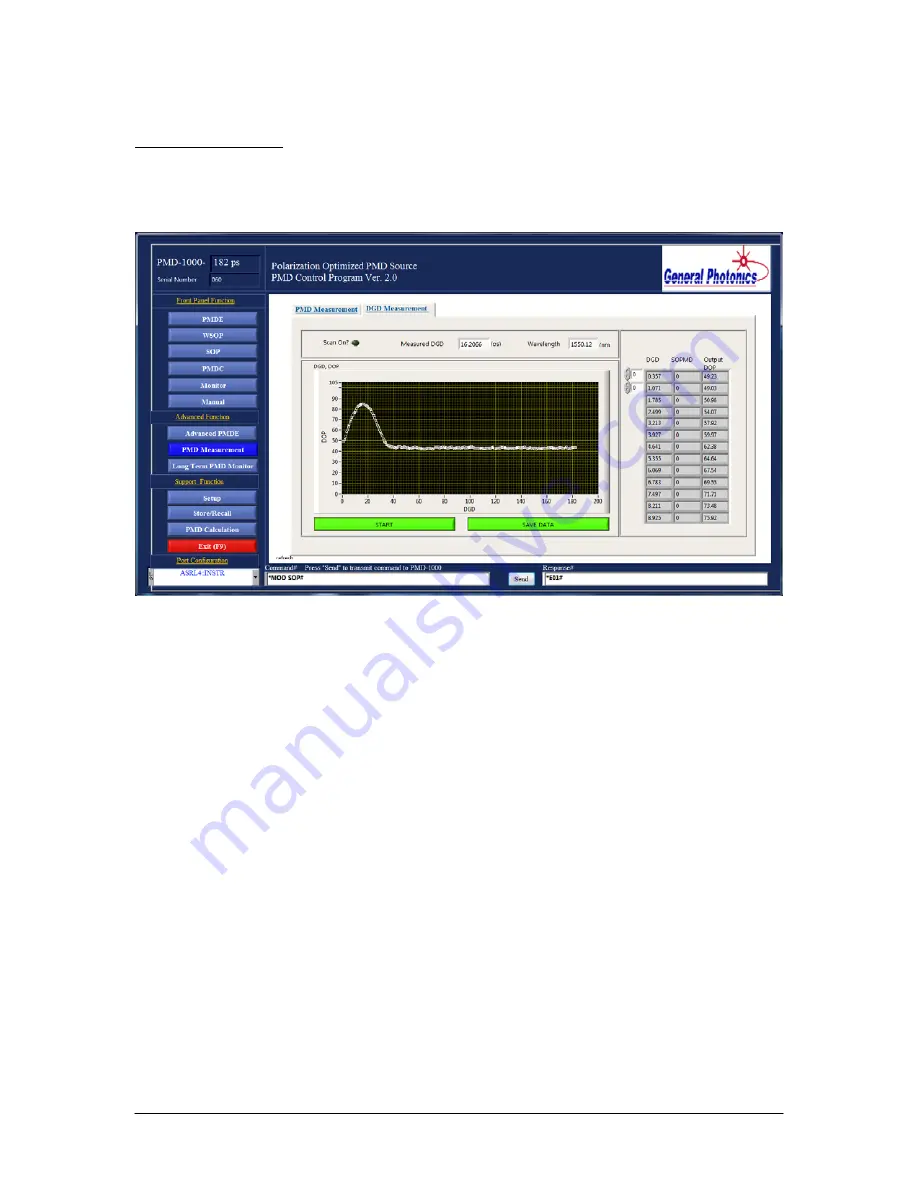
DGD Measurement:
This function scans through the DGD-only states in the lookup table (discrete mode) and
optimizes the SOP at each state to maximize the output DOP.
There are no selection parameters for this scan. Click “Start” to start the scan. While the
scan is running, the “Scan on?” indicator will be green. When the scan is finished, the
DGD and SOPMD values and the corresponding maximum output DOP are displayed in
the table on the right of the screen, and the maximum output DOP vs. DGD is plotted in
the graph. The DGD value with the highest output DOP is displayed in the “Measured
DGD” box at the top of the screen.
The graph serves as a measurement of both the PMD in the system and of how much of
an effect PMD compensation will have. The DGD value corresponding to the peak DOP
in the plot is the DGD in the input signal to the PMD-1000. The height of the peak
relative to the baseline DOP indicates the effect of PMD compensation.
After the scan is finished, the data can be saved to a file by clicking “SAVE DATA”.
Data is saved as a text file with 2 columns: DGD and DOP.
Document #: GP-UM-PMD-1000-21
Page 85 of 122


