


98
5. CUSTOM PAGES
80703B_MHW_2850T/3850T_02-2019_ENG
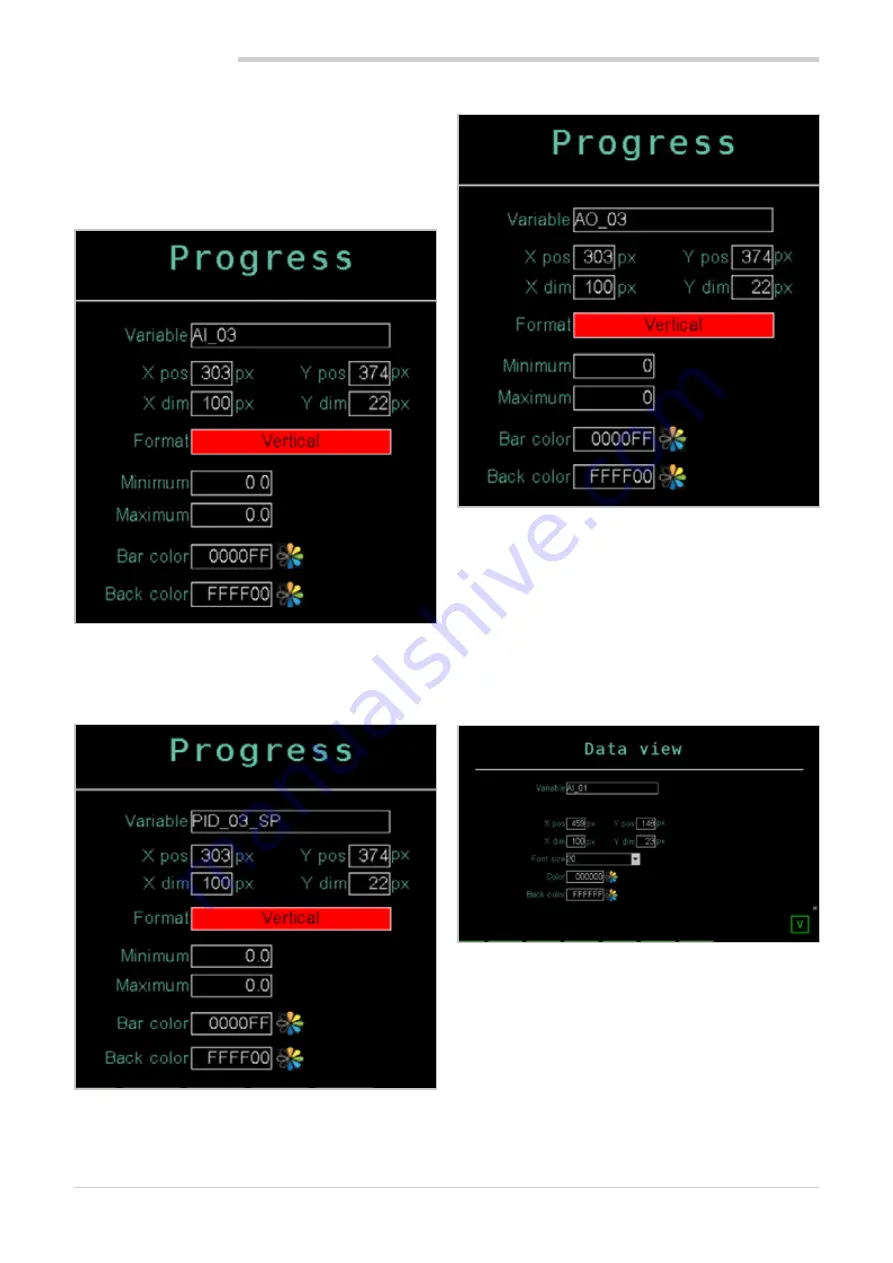
5.4.2. Adding Bar Graphs
Add the three bars to the page to graphically display pro-
cess data percent.
For general instructions on adding and configuring a Bar
Graph, see paragraph “5.3.7. Progress Bar component” on
page 94.
Bar Graph for PV (1)
Add a Bar Graph component and set parameters to display
the PID1 PV value.
Bar Graph for SP (2)
Add a Bar Graph component and set parameters to display
the PID1 SP value. Notice how the Xdim, Ypos, and Ydim
values are the same as those of the Bar Graph component
for PV.
Bar Graph for OUT (3)
Add a Bar Graph component and set parameters to display
the PID1 OUT value. Notice how the Ypos and Ydim values
are the same as those of the Bar Graph component for PV.
5.4.3. Adding Data View
Add the Data View component to the page to display the
numeric value of the PV process value.
For general instructions on how to enter and configure a
Data View read-only component see paragraph “5.3.8. Data
View component” on page 95.
Configure Data View (4) component parameters to display
the PID1 PV value.
Summary of Contents for 2850T
Page 2: ......
Page 6: ...80703B_MHW_2850T 3850T_02 2019_ENG 4...
Page 10: ...80703B_MHW_2850T 3850T_02 2019_ENG 8...
Page 20: ...80703B_MHW_2850T 3850T_02 2019_ENG 18...
Page 34: ...80703B_MHW_2850T 3850T_02 2019_ENG 32...
Page 104: ...80703B_MHW_2850T 3850T_02 2019_ENG 102...
Page 106: ...80703B_MHW_2850T 3850T_02 2019_ENG 104...
Page 124: ...80703B_MHW_2850T 3850T_02 2019_ENG 122...
Page 128: ...80703B_MHW_2850T 3850T_02 2019_ENG 126...
Page 156: ...80703B_MHW_2850T 3850T_02 2019_ENG 154...


