


DSP-4000 Series
Users Manual
3-12
Pressing
#
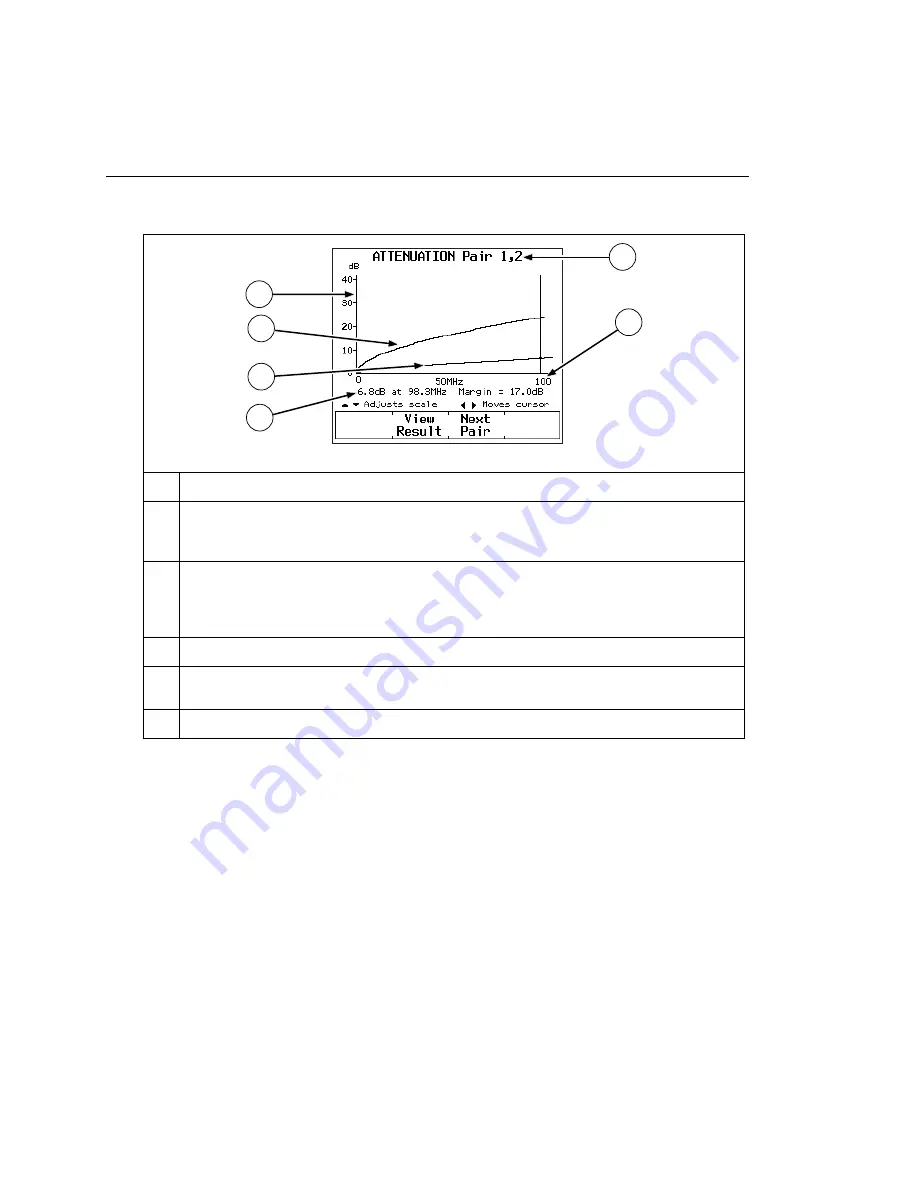
View Plot
produces the attenuation plot screen. Figure 3-4
describes an example of the screen.
5
1
2
6
4
3
oy10c.eps
1
The cable pair relevant to the plot.
2
Frequency range in MHz. Use
U D
to switch between frequency scales. To switch to the
next lowest or highest range, use
L R
to move the cursor beyond the left or right side of
the plot.
3
The attenuation level, frequency, and margin at the cursor’s position. Margin is the
difference between the limit and the measured value. If you move the cursor beyond the
highest test frequency specified by the selected test standard, the readout shows the
attenuation value at the cursor’s position.
4
The measured attenuation for the cable pair.
5
The attenuation limits, as defined by the selected test standard. A crosshair is shown if the
limit is defined for only one frequency.
6
Decibels of attenuation.
Figure 3-4. The Attenuation Plot Screen
Summary of Contents for CableAnalyzer DSP-4000 Series
Page 6: ...DSP 4000 Series Users Manual iv...
Page 8: ...DSP 4000 Series Users Manual vi...
Page 18: ...DSP 4000 Series Users Manual 1 8...
Page 60: ...DSP 4000 Series Users Manual 2 42...
Page 128: ...DSP 4000 Series Users Manual 6 6...
Page 160: ...DSP 4000 Series Users Manual 7 32...
Page 186: ...DSP 4000 Series Users Manual 8 26...
Page 188: ...DSP 4000 Series Users Manual...
Page 204: ...DSP 4000 Series Users Manual B 14 oy81f bmp Figure B 5 Autotest Report in Graphical Format...
Page 210: ...DSP 4000 Series Users Manual B 20...
Page 222: ...DSP 4000 Series Users Manual C 12...


