150
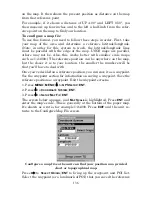
The height scale on the top right side of the graph changes, based upon
the maximum
range
of the tide for that day. The MLLW line also ad-
justs its position as the height scale changes.
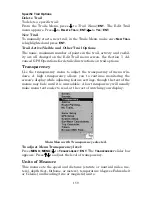
You can look up tidal data for other dates by changing the month, day
and year selection boxes. To select another date:
1. Use
←
→
to highlight month, day or year, then press
ENT
.
2. Use
↑
↓
to select the desired month, day or year and press
ENT
.
To clear the information screen, press
EXIT
.
Navionics
Charts
Your unit can also display Navionics electronic charts on MMCs. Like
NauticPath, Navionics charts contain tide and port service information.
NOTE:
The primary operational difference between a NauticPath chart
and a Navionics chart is the way the chart data is set up for dis-
play. NauticPath charts are ready for display as soon as they are
inserted into the unit. Navionics charts must be inserted into the
unit, then selected as a Map Choice option in the Map Data menu.
To display a Navionics chart:
1. Install the Navionics MMC in the memory card compartment and
turn on the unit. (For full card install instructions, see Sec. 2.)
2. From the Map Page, press
MENU
|
↓
to
M
AP
D
ATA
|
ENT
|
↓
to
M
AP
C
HOICE
|
ENT
. Select the
Map Name
, then press
ENT
|
EXIT
|
EXIT
.
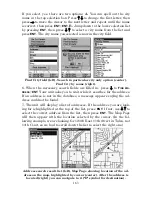
Map Choice highlighted on Map Data menu (left). Miami Navionics
chart selected from Map Choice menu (right).
Summary of Contents for IntelliMap 502C iGPS
Page 92: ...84 Notes ...
Page 188: ...180 Notes ...
Page 189: ...181 Notes ...
Page 190: ...182 Notes ...

