Day-to-Day Operation
EY.65.H4.02
11
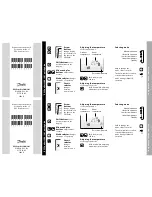
System status
To view status information for the entire plant:
1.
From the System Overview, use
and
to display further information.
See illustration below.
Depending on the selected application and the sensors connected to the system, the
following status information can be available:
2
Day temperature
This picture displays the highest and lowest outdoor temperature measured since
midnight. The
symbol indicates that the actual temperature is rising. A
indicates
that the temperature is falling.
Degree days
The number of degree days calculated since the first day of the current month and the
number of degree days calculated since the change of season.
3
The following status information is only available when the appropriate sensors are
connected to the ECL 2000:
Sun intensity
Actual value of sun intensity.
Wind velocity
Actual wind velocity.
Water Flow
Actual value of water flow.
Energy
Actual value of energy consumption.
Other
Actual reading from a user-defined sensor connected to the control-
ler.
2
See page 27 for information on configuring the ECL 2000’s sensor inputs and LON inputs
3
By default, the season for degree day calculation starts on 1. June
Sensor S8 and S9
Sensor S10 and S11
(ECL 2000 Type 2 only)
Sensor L1 and L2
(LON option installed)
Sensor L3 and L4
(LON option installed)
Summary of Contents for ECL 2000
Page 1: ...User s Guide ECL 2000 11 99 EY 65 H4 02...
Page 2: ......
Page 3: ...User s Guide ECL 2000 Danfoss A S EY 65 H4 02...
Page 8: ...Introduction EY 65 H4 02 2 This page is intentionally left blank...
Page 30: ...Weather Compensation Curves EY 65 H4 02 24 This page is intentionally left blank...
Page 67: ...Service Settings EY 65 H4 02 61 This page is intentionally left blank...
Page 92: ...Appendix B Service Menus EY 65 H4 02 86...
Page 98: ...Glossary EY 65 H4 02 92 This page is intentionally left blank...
Page 100: ...References EY 65 H4 02 94 This page is intentionally left blank...
Page 106: ...Index EY 65 H4 02 100...