


15-10
u
To delete all plots
Press
K
6
(
g
)
4
(DELETE), and a confirmation dialog box will appear. Press
1
(Yes) to
delete all of the plots. To cancel the delete operation, press
6
(No) instead.
Note
• In addition to using the plot list screen to delete all plots, you also can sequentially delete
plots one-by-one, starting from the last point plotted. See “Deleting the Last Plot Data Line”
(page 15-14).
k
Inputting an Expression of the Form Y=
f
(
x
) and Graphing It
You can draw a graph based on an expression with the form Y=
f
(
x
) on the Picture Plot screen.
From the Picture Plot screen, press
K
4
(DefG) to display the graph relation list screen.
From there, operations are identical to those in the
Graph
mode.
Note
• The data on the graph relation list screen is shared with the
Graph
mode. Note, however,
that only Y= type graphs can be used in the
Picture Plot
mode. Because of this, calling up
the graph relation list screen from the
Picture Plot
mode will display a “Y” (Y= type) item for
function menu key
3
. Also note that the
5
(MODIFY) function menu item is not displayed
on the graph relation list screen. The Modify function can be executed from the Picture Plot
screen.
• Y= type expressions on the graph relation list screen that include variables can be modified
by pressing
K
5
(MODIFY) while the Picture Plot screen is displayed. For details about
this operation, see “Modifying a Graph” (page 5-36).
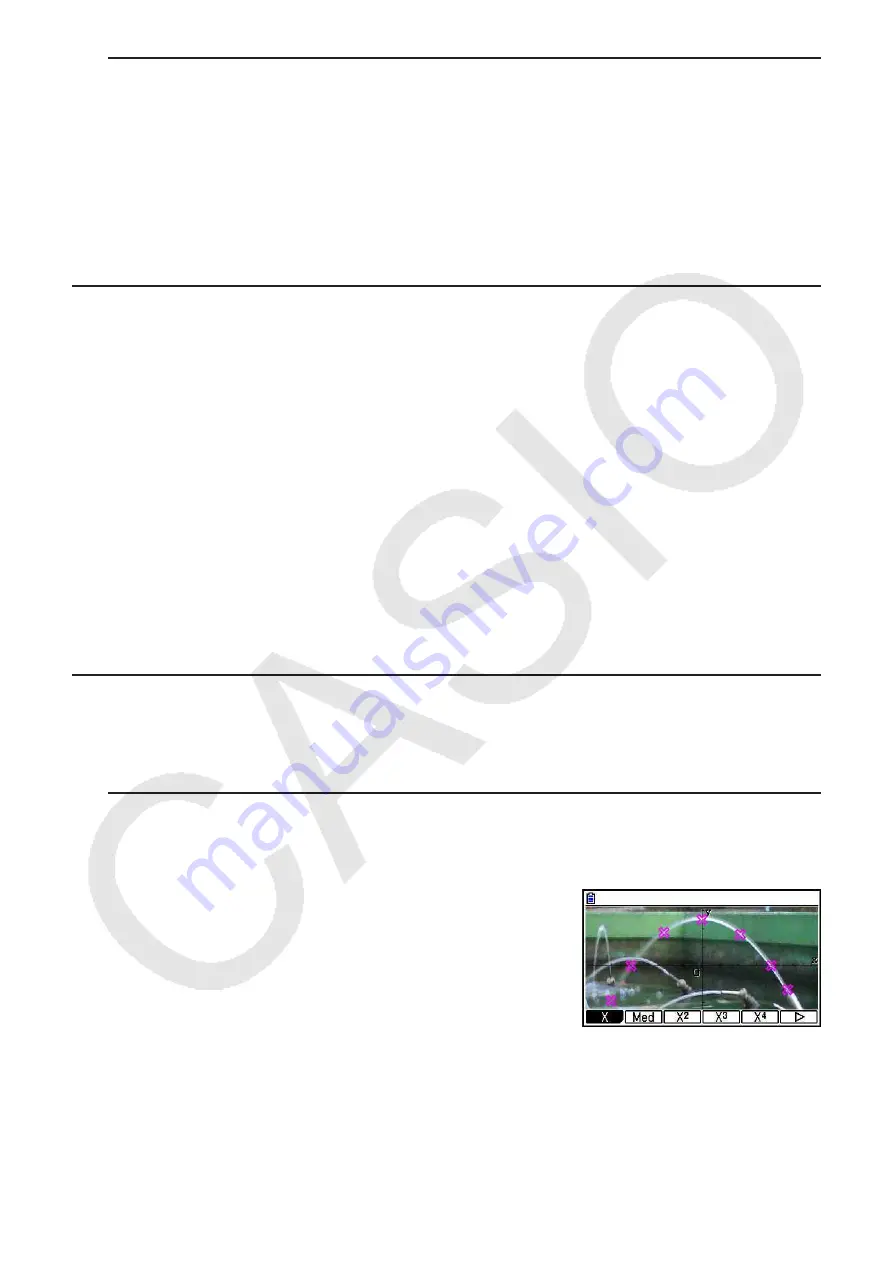
k
Using Regression Graphs
You can perform regression calculation based on plotted coordinate values and draw a
regression graph.
u
To draw a regression graph overlaid on plots
1. Perform the procedure under “To plot points on the screen” (page 15-7).
2. Press
K
6
(
g
)
2
(REG).
• This displays the regression calculation type function
menu.
Summary of Contents for FX-CG10
Page 555: ...E CON3 Application English...


