SECTION 3 OPERATING THE BIS VIEW MONITORING SYSTEM
______________________________________________________________________
3-11
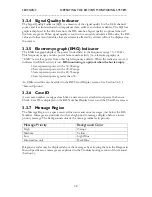
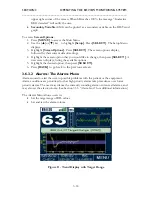
Filtered electroencephalogram (EEG) waveforms are displayed with a sweep rate of 25
millimeters per second and a scale of 25 microvolts per division. When artifact is present, the
label ‘artifact’ is displayed at the top of the screen. When the artifact is excessive, a message
appears in the message region of the screen, and data that could be corrupted by artifact,
such as the BIS number, are not displayed.
A test is performed immediately after every sensor check and at 10-minute intervals during
monitoring to check the status of the patient ground connection. During the test, the EEG
display shows a flat line and the message “GROUND CHECK” displays on the screen.
To make this screen the default screen, go to: MENU>Setup>Screen Options>BIS Display
and select
Trend/EEG
See instructions in Section 3.6.3.1 “Screen Options.”
3.6
Menu Selections
Before using the BIS VIEW monitor for the first time, you may want to update the monitor
with your desired screen settings and the current date and time. You should also familiarize
yourself with the various menu options available. This section describes the menu options
available and how they work.
To make a selection from a menu, use the [
▲
] (Up) or [
▼
] (Down) soft keys until
the desired menu item is highlighted, then press [SELECT] to make your selection.
To exit without making a selection or changing a setting, press [HOME].
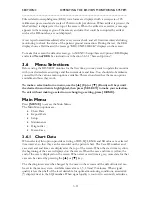
Main Menu:
Press
[MENU]
to access the Main Menu.
The Main Menu options are:
•
Chart Data
•
Export Data
•
Setup
•
Maintenance
•
Diagnostics
•
Demo Case
3.6.1
Chart Data
When selected, this option provides a listing of BIS, SQI, EMG and SR values at a selected
time interval, so that they can be recorded on the patient chart. The Case ID number and
case start and end times are displayed at the top of the screen. When the start time is yellow,
the beginning of the case is displayed on the screen. When the case end time is yellow, the
end of the case is displayed on the screen. When start or end time is grey, more data for that
case can be viewed by pressing the
[
▲
]
or
[
▼
]
key.
The charting interval can be changed by the user on the screen and the default interval can
be set in the menu system. Available intervals are 1, 5, 10 and 15 minutes. When signal
quality is less than half of the level desirable for optimal monitoring conditions, an asterisk
(*) displays next to the SQI number. When signal quality is too low to accurately calculate a

