background image

Анализатор


интерференций


3-5 

Мощность


сигнала


Возможность


измерения


мощности


сигнала


удобна


для


выявления


источника


сигнала


помехи

Данное


измерение


выполняется


на


одной


частоте


в


нулевой


полосе


обзора

На


экране


прибора


отображается


мощность


на


используемой


частоте

 (

в


дБм


или


ваттах

и


выдается


звуковая


индикация

 (

опция

). 

После


подключения


направленной


антенны


частота


звукового


индикатора


увеличивается


с


возрастанием


мощности


измеряемого


сигнала

Этот


режим


особенно


полезен


при


попытках


локализовать


излучатель


с


помощью


направленной


антенны


Для


измерения


напряженности


поля


в


прибор


записаны


антенные


коэффициенты

В


приборе


хранится


информация


об


антенных


коэффициентах


всех


антенн

предлагаемых

 Anritsu.  

С


помощью


программы


Master Software Tools, 

выпускаемой


компанией

 Anritsu, 

пользователь


может


создать


и


загрузить


в


прибор


свои


собственные


антенные


коэффициенты

.  

Процедура


Описываемая


ниже


процедура


демонстрирует


стандартную


настройку


анализатора


интерференций


для


измерения


мощности


сигнала

.  

1. 

Подключите


подходящую


направленную


антенну


к


порту


RF In


и


нажмите


клавишу


главного


меню


Measurements

2. 

Нажмите


клавишу


подменю


Signal Strength

на


экране


отобразится


режим


измерения


мощности


сигнала

Нажмите


клавишу


подменю


Signal Strength

откроется


меню

 Signal Strength. 


3. 

Нажмите


клавишу


подменю


Auto Scale


для


автоматического


масштабирования


диапазона


отображения


или


установите


желаемые


максимальные


и


минимальные


значения


нажатием


клавиш


подменю


Max Level


и


Min Level

.


4. 

Нажмите


клавиши


подменю


Speaker On/Off


для


включения


аудио


выхода


5. 

При


необходимости


нажмите


клавишу


подменю


Volume


для


установки


громкости


динамика


или


наушников


на


комфортный


уровень

Используйте


клавиши


Вверх

/

Вниз


для


регулировки


уровня


громкости


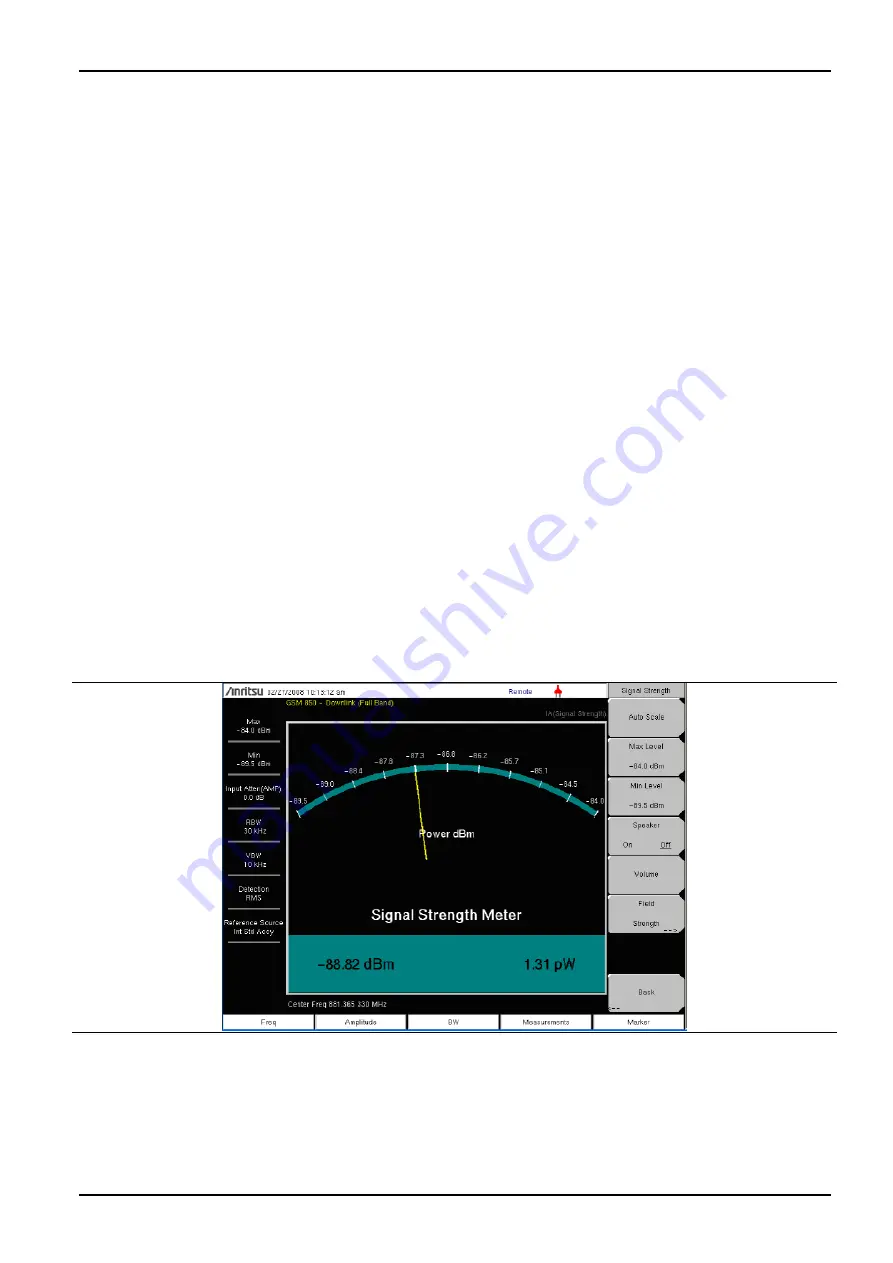
Рис

.  3-2

Измерение


мощности


сигнала


в


режиме


анализатора


интерференций


3-4 

Шифр

: 10580-00231 

Ред

В


Анализатор


спектра

РИ


          ООО "Техэнком"     Контрольно-измерительные приборы и оборудование     www.tehencom.com          

Summary of Contents for Spectrum Master MS2720T

Page 1: ...тивные MS2720T Spectrum Master TM Компактный переносной анализатор спектра Anritsu Company 490 Jarvis Drive Morgan Hill CA 95037 2809 USA 10580 00340AR Редакция A Январь 2013 ООО Техэнком Контрольно измерительные приборы и оборудование www tehencom com ...

Page 2: ...ООО Техэнком Контрольно измерительные приборы и оборудование www tehencom com ...

Page 3: ...ЗАМЕНЕ ИЗДЕЛИЯ НАСКОЛЬКО ЭТО РАЗРЕШЕНО ДЕЙСТВУЮЩИМ ЗАКОНОДАТЕЛЬСТВОМ НИ КОМПАНИЯ ANRITSU НИ ЕЕ ПОСТАВЩИКИ НЕ МОГУТ БЫТЬ ПРИВЛЕЧЕНЫ К ОТВЕТСТВЕННОСТИ В СВЯЗИ С КАКИМ ЛИБО ФАКТИЧЕСКИМ СЛУЧАЙНЫМ КОСВЕННЫМ ИЛИ ПОСЛЕДУЮЩИМ УЩЕРБОМ ВКЛЮЧАЯ НО НЕ ТОЛЬКО УЩЕРБ В РЕЗУЛЬТАТЕ ПОТЕРИ ТОРГОВОЙ ПРИБЫЛИ ПРЕРЫВАНИЯ ДЕЯТЕЛЬНОСТИ ПОТЕРИ КОММЕРЧЕСКОЙ ИНФОРМАЦИИ И ИНОЙ УЩЕРБ ФИНАНСОВОГО ХАРАКТЕРА ВСЛЕДСТВИЕ ИСПОЛЬЗОВ...

Page 4: ...равительством страны происхождения продукта Перед тем как реэкспортировать изделие или руководства свяжитесь с нами для выяснения распространяется ли на данные товары экспортный контроль или нет При утилизации изделий руководств на которые распространяется действие экспортного контроля необходимо вывести их из строя уничтожить в бумагорезательном аппарате для предотвращения их нелегального использ...

Page 5: ...ООО Техэнком Контрольно измерительные приборы и оборудование www tehencom com ...

Page 6: ...4kV CD 8kV AD EN 61000 4 3 2006 A2 2010 3V m EN 61000 4 4 2004 0 5kV SL lkV PL EN 61000 4 5 2006 0 5kV L L lkV L E EN 61000 4 6 2009 3 V EN 61000 4 11 2004 100 20ms Требования электробезопасности Безопасность изделия EN61010 1 2010 подписано ___________________________________________ Эрик МакЛин Директор отдела контроля качества 18 декабря 2012г ___________________________ Дата Morgan Hill CA Кон...

Page 7: ...ы должные меры предосторожности Для сокращения риска выполняйте все меры предосторожности и соответствующие процедуры Предупреждающие символы используемые на оборудовании и в руководстве Указанные предупреждающие символы используются внутри или на оборудовании рядом с местом эксплуатации и предоставляют информацию о необходимых мерах безопасности и предосторожности Важно чтобы пользователь четко п...

Page 8: ...м если она выполняется необученным специалистом Кроме того существует опасность повреждения прецизионных частей Внимание Электростатический разряд может стать причиной повреждения высокочувствительных цепей в изделии Электростатический разряд как правило возникает при подключении или отключении контрольных приборов от портов и разъемов на передней и задней панелях анализатора Пользователь может об...

Page 9: ...2 1 2 2 Обзор аппаратных средств 2 2 Включение прибора MS2720T первый раз 2 2 2 3 Обзор разъемов измерительной панели 2 3 2 4 Уход за разъемами 2 7 Процедура соединения 2 7 Процедура отсоединения 2 7 2 5 Обзор передней панели 2 8 Графический интерфейс пользователя ГИП 2 9 Органы управления и индикации на передней панели 2 9 Клавиши на передней панели 2 10 2 6 Сенсорный экран 2 11 Графический интер...

Page 10: ...змерений 3 4 3 4 Установка амплитуды 3 5 Установка опорного уровня и шкалы 3 5 Установка диапазона амплитуд и шкалы 3 5 Установка смещения уровня для компенсации внешнего ослабления или усиления 3 6 3 5 Настройка полосы обзора 3 6 3 6 Установка ограничительных линий 3 7 Простая ограничительная линия 3 7 Огибающая ограничительная линия 3 7 Сегментированная ограничительная линия 3 8 3 7 Установка ма...

Page 11: ... Меню System карта 1 5 2 Меню System карта 2 5 3 5 3 Меню System 5 4 Меню System Options 5 5 Меню System Options 2 2 5 6 Меню Power On 5 8 Меню Display Settings 5 9 Меню Reset 5 10 5 4 Меню Preset 5 11 5 5 Процедура самотестирования 5 11 5 6 Обновление встроенного ПО анализатора Spectrum Master 5 12 Обновление с использованием карты памяти USB 5 12 Способы загрузки файлов обновления 5 12 Обновлени...

Page 12: ...зопасная работа с данными B 1 Пароль при работе в дистанционном режиме B 2 Типы памяти используемые в приборе Spectrum Master B 2 Удаление всех файлов пользователя из внутренней памяти B 3 Рекомендуемое использование в защищенной среде B 4 Приложение C Сообщения об ошибках C 1 C 1 Введение C 1 C 2 Ошибки самодиагностики системы и самодиагностики приложения C 1 C 3 Ошибки во время работы C 2 Прилож...

Page 13: ...ства по проведению измерений В руководстве по эксплуатации вышеуказанное изделие именуется как Spectrum Master или модель MS2720T 1 2 Обращение в Anritsu Для обращения в Anritsu посетите страницу http www anritsu com contact asp где вы сможете получить актуальную информацию о торговых и обслуживающих представительствах в вашем регионе заполнить форму обратной связи задать вопрос или получить други...

Page 14: ...тра 9 кГц 9 ГГц MS2720T 0713 Анализатор спектра 9 кГц 13 ГГц MS2720T 0720 Анализатор спектра 9 кГц 20 ГГц MS2720T 0732 Анализатор спектра 9 кГц 32 ГГц MS2720T 0743 Анализатор спектра 9 кГц 43 ГГц MS2720T 0809 Следящий генератор 9 ГГца MS2720T 0813 Следящий генератор 13 ГГца MS2720T 0820 Следящий генератор 20 ГГца а Частота следящего генератора должна соответствовать частоте главного блока Например...

Page 15: ...0T 0031 Приемник GPS требуется антенна GPS шифр 2000 1528 R или 2000 1652 R MS2720T 0089 Выход ПЧ нулевой полосы обзора MS2720T 0090 Ждущая развертка MS2720T 0431 Нанесение данных о покрытии на карту требуется опция 31 MS2720T 0509 Анализатор АМ ЧМ ИМ MS2720T 0880 Демодуляция GSM GPRS EDGE b MS2720T 0881 Измерения W CDMA HSDPA b MS2720T 0882 Измерения TD SCDMA HSDPA b MS2720T 0883 Измерения LTE FD...

Page 16: ... В нижней части интернет страницы анализатора Spectrum Master находится таблица со ссылками на соответствующую документацию и программное обеспечение в т ч Примечания по применению Брошюры Технические описания Инструкции Технические примечания Технические описания Программное обеспечение Master Software Tools 1 7 Описание анализатора Spectrum Master это основанный на синтезаторе портативный анализ...

Page 17: ...ПК с помощью поставляемого кабеля USB или Ethernet После того как графическая кривая измерения была сохранена ее можно вывести на экран представить в нужном масштабе или добавить маркеры и линии пределов Прошлые графики можно накладывать на текущие данные с помощью мыши ПК в стиле буксировки Выделенные данные можно извлечь и использовать их в электронных таблицах или в других приложениях для анали...

Page 18: ...ны накапливают статический заряд который может повредить входные цепи MS2720T в результате разряда при непосредственном подключении к MS2720T без предварительного снятия статического заряда Пользователи MS2720T всегда должны помнить о возможности повреждения в результате воздействия электростатического заряда и принимать все необходимые меры предосторожности Пользователи должны придерживаться проц...

Page 19: ...тором Spectrum Master могут потребовать предварительной зарядки перед использованием Аккумуляторы можно зарядить в Spectrum Master с помощью адаптера постоянного переменного тока или адаптера постоянного тока 12 В или отдельно в зарядном устройстве для двух аккумуляторов 2000 1374 опция Описание индикаторов зарядки приводится на стр 2 23 Символы и индикаторы Внимание При использовании адаптера для...

Page 20: ...нель придает сумке форму необходимую для помещения внутрь прибора 2 Положите сумку передней панелью вниз на ровную поверхность 3 Откройте с помощью молнии заднюю часть сумки Примечание Задняя часть сумки открывается с помощью двух молний Молния которая находится ближе к передней стенке используется при извлечении прибора из сумки и помещения его внутрь Вторая молния которая расположена ближе к зад...

Page 21: ...ет съемный наплечный ремень пристегивающийся к сумке с помощью колец в верхних углах сумки что обеспечивает удобство переноски и использования 1 15Наклонная подставка опора Наклонная подставка опора может использоваться при работе с прибором на столе Она обеспечивает наклонное положение прибора и улучшает вентиляцию Для установки подставки необходимо потянуть ее за нижний край в направлении от при...

Page 22: ...ООО Техэнком Контрольно измерительные приборы и оборудование www tehencom com ...

Page 23: ...плитуды предельной линии маркеров процедуре сохранения файлов и обновлению программного обеспечения Подробнее об использовании прибора см в Руководствах по проведению измерений Руководства по проведению измерений а также копия данного руководства по эксплуатации находятся на диске документации в PDF формате а также доступны на интернет сайте компании Anritsu http www anritsu com Перечень доступных...

Page 24: ...кт поставки список принадлежностей в зависимости от конкретной модели прибора см в разделе Введение на стр 1 1 Внимание При использовании адаптера для работы от автомобильного прикуривателя всегда проверяйте рассчитан ли источник на выходную мощность не менее 60 Ватт и постоянное напряжение 12В и что гнездо не загрязнено Если штепсель адаптера сильно нагревается во время работы немедленно прекрати...

Page 25: ...ой панели опций 709 713 720 анализатора MS2720T 1 Ввод внешнего сигнала запуска Ext Trigger In 2 Ввод внешней опорной частоты Ext Ref In 3 Вентиляционное отверстие 4 Порт ввода ВЧ сигнала анализатора спектра RF In разъем типа N 5 Место подключения опции Следящий генератор ВЧ выход разъем типа N 6 Разъем для подключения внешнего питания 7 Подключение к локальной сети 8 Интерфейс USB тип А 9 Интерфе...

Page 26: ...разъем на 50 Ω Ext Trigger 50Ω запускает одиночный проход качающегося сигнала В режиме анализатора спектра это используется при нулевой полосе обзора и запуск происходит по нарастающему фронту сигнала По завершении качающегося сигнала и до прихода следующего запускающего сигнала на экране отображается полученная кривая измерения Для затягивания разъема типа BNC не используйте плоскогубцы или гаечн...

Page 27: ...ешнего питания Вход представляет собой цилиндрический разъем 2 1 мм на 5 5 мм рассчитанный на постоянное напряжение от 12В до 15В и ток до 5А Разъем внешнего питания предназначен для питания устройства и зарядки батареи Мигающий зеленый индикатор возле кнопки включения показывает что батарея заряжается от внешнего источника питания Индикатор светится непрерывно когда батарея полностью заряжена Пре...

Page 28: ...шников на 3 5 мм такого же который обычно используется в сотовых телефонах Вывод опорной частоты Ref Out 10 MHz Разъем выхода внешнего опорного сигнала представляет собой гнездовой BNC разъем на 50 Ом через который выдается сигнал опорной частоты 10 МГц на уровне примерно 0 дБм Для затягивания разъема типа BNC не используйте плоскогубцы или гаечный ключ В противном случае возможно повреждение приб...

Page 29: ...льный штифт вилочного разъема должен концентрически входить в контакты гнездового разъема Соедините разъемы направив их друг к другу Не допускайте поворачивания при присоединении разъемов При затягивании разъема поворачивайте только гайку разъема При повороте корпуса разъема возможно серьезное повреждение центральной жилы проводника и внешнего экрана При использовании динамометрического ключа необ...

Page 30: ... 3 Клавиши подменю активное меню или активный функциональный блок 4 Кнопка Menu 5 Индикатор питания и индикатор заряда аккумулятора 6 Клавиша включения выключения 7 Клавиша Enter и клавиши со стрелками 8 Поворотная кнопка 9 Цифровая клавиатура включая клавиши Shift и Esc 10 Входное вентиляционное отверстие 11 Экран измерения или окно развертки 12 Клавиши главного меню 13 Выходное вентиляционное от...

Page 31: ...ов дополнительной функции осуществляется с помощью клавиши Shift Например для вызова процедуры калибровки сенсорного экрана используйте клавишу Shift и клавишу 0 см стр 2 15 Клавиша Esc используемая для прерывания ввода данных расположена рядом с клавишей Shift над клавишами с цифрами Поворотная кнопка клавиши стрелки цифровая клавиатура служат для изменения значения активного параметра Индикатор ...

Page 32: ...елка вправо Стрелка влево отличается от шага клавиш Стрелка вниз Стрелка вверх или шага поворотной кнопки Клавиши стрелки также используются для перемещения маркеров Поворотная кнопка Поворотная кнопка позволяет изменить числовые значения пролистать позиции в списке и переместить маркеры Изменяемые значения могут находиться внутри диалоговых окон или окон редактирования Клавиша Shift Нажмите клави...

Page 33: ...этого можно прикасаться и к другим областям экрана для выполнения задач доступных при нажатии клавиши меню Например 1 При нажатии настройки полосы пропускания RBW в левой части экрана сводные данные о настройках открывается меню настройки полосы пропускания BW 2 После установки маркера на экране его можно переместить прикосновением к кривой измерения 3 Прикосновение к окну с типами файлов в одном ...

Page 34: ...см в разделе 2 10 Обзор экрана на стр 2 19 Клавиша Menu Нажатие клавиши Menu открывает экран с ярлыками установленных режимов измерения а также пользовательских меню и файлов настроек На рис 2 6 показан экран клавиши Menu с ярлыками установленных режимов измерения Для изменения режима прикоснитесь к одной из иконок в верхних двух рядах Данные иконки являются предустановленными их удаление или пере...

Page 35: ...ие нескольких секунд Теперь выберите место для размещения ярлыка Рисунок 2 7 Экран клавиши Menu Ярлыки созданные пользователем остаются в памяти до их удаления Чтобы удалить или переместить кнопку ярлыка нажмите клавишу Menu затем прикоснитесь к ярлыку и удерживайте его в течение примерно 3 секунд На экране появится окно Customize Button с помощью которого можно удалить или переместить кнопку Чтоб...

Page 36: ...0340R ред А РЭ MS2720T Справку по экрану Menu можно вызвать нажатием вопросительного знака в нижнем правом углу экрана Рисунок 2 8 Справка по экрану Menu ООО Техэнком Контрольно измерительные приборы и оборудование www tehencom com ...

Page 37: ...гации с помощью стрелок Для входа в режим навигации с помощью стрелок нажмите 1 нажатие Esc позволяет отказаться от включения режима В режиме навигации с помощью стрелок выбранная клавиша отмечается красной рамкой см рис 2 9 на стр 2 16 Для перемещения красной рамки выделения используйте клавиши со стрелками Затем нажмите клавишу Menu выбранная сенсорная клавиша будет активизирована Обратите внима...

Page 38: ...Обзор прибора 2 16 PN 10580 00340R ред А РЭ MS2720T Рисунок 2 9 Пример управления с помощью стрелок ООО Техэнком Контрольно измерительные приборы и оборудование www tehencom com ...

Page 39: ...шами со стрелками или поворотной кнопкой затем нажмите клавишу Enter для подтверждения своего выбора Список режимов который появится в этом меню будет зависеть от установленных и активизированных опций На рис 2 10 приводится пример меню выбора режима Mode Возможно что на экране Вашего прибора отобразится другой список Рисунок 2 10 Меню выбора режима ООО Техэнком Контрольно измерительные приборы и ...

Page 40: ...ибора Однако если та или иная функция доступна в определенном режиме работы то соответствующее ей меню можно активизировать с помощью цифровой клавиатуры Доступ к данному меню можно также получить с помощью клавиш главного меню и контекстных клавиш Имеются следующие меню дополнительных функций Touch 0 Preset 1 Calibrate 2 Sweep 3 Measure 4 Trace 5 Limit 6 File 7 System 8 Mode 9 Примечание Нажатие ...

Page 41: ...е Режим анализатора спектра На рис 2 12 показаны некоторые информационные области экрана MS2720Т Детальное описание режима анализатора спектра приводится в Руководстве по проведению измерений анализатора спектра шифр продукта Anritsu 10580 00349 которое находится диске с документацией и доступно на сайте компании Anritsu Полный перечень руководств по проведению измерений приводится в Приложении А ...

Page 42: ...ения активных маркеров 3 Экран измерения или сетка измерения или окно развертки 4 Индикатор заряда аккумулятора 5 Режим прибора 6 Метки клавиш подменю или активный блок функций 7 Метки клавиш главного меню 8 Дополнительное окно с данными также место вывода таблицы маркеров 9 Сводные данные о настройках прибора ООО Техэнком Контрольно измерительные приборы и оборудование www tehencom com ...

Page 43: ...ками или клавиатуры Нажатие одной из клавиш главного меню отображает по правому краю сенсорного экрана список подменю Значение клавиши подменю отмеченное красным цветом на сетке окна развертки доступно для изменения При использовании поворотной кнопки или клавиш со стрелками изменяющееся значение отображается в подменю и красным цветом на сетке При использовании клавиатуры новое значение отображае...

Page 44: ...вляется непосредственно с клавиатуры на сенсорном экране Для ввода числовой информации можно использовать приборную клавиатуру Клавиши со стрелками влево вправо используются для перемещения курсора по тексту Подробнее см в разделе Меню Save на стр 4 8 Рисунок 2 13 Клавиатура на сенсорном экране для сохранения результатов измерения ООО Техэнком Контрольно измерительные приборы и оборудование www te...

Page 45: ... осуществлении зарядки и горит непрерывно когда батарея полностью заряжена Внимание Для работы с анализатором используйте только одобренные компанией Anritsu аккумуляторы адаптеры и зарядные устройства Индикатор батареи на экране прибора меняет свой вид на электрическую вилку красного цвета в том случае когда питание осуществляется от внешнего источника а батарея не заряжается или отсутствует При ...

Page 46: ... меню Save стр 4 10 Иконка располагается между данными GPS и символом батареи в верхней части экрана Прикосновение к иконке открывает сенсорную клавиатуру которая используется для сохранения измерений настроек ограничительных линий или снимков экрана в формате JPEG см рис 4 1 раздел Диалоговое окно Save на стр 4 3 ООО Техэнком Контрольно измерительные приборы и оборудование www tehencom com ...

Page 47: ...уда Custom Scan Сканирование по списку пользователя Measurements Измерения Измеритель мощности Freq Частота Amplitude Амплитуда Average Усреднение Limits Ограничения Высокоточный измеритель мощности Amplitude Амплитуда Average Усреднение Zero Cal Установка нуля калибровка Limits Ограничения Анализатор сигналов GSM GPRS EDGE Freq Частота Amplitude Амплитуда Setup Установки Measurements Измерения Ma...

Page 48: ...литуда Setup Установки Measurements Измерения Marker Маркер Анализатор АМ ЧМ ИМ Freq Частота Amplitude Амплитуда Setup Установки Measurements Измерения Marker Маркер Анализатор пассивной интермодуляции PIM Freq Частота Amplitude Амплитуда Setup Установки Measurements Измерения Marker Маркер Клавиши подменю Восемь сенсорных клавиш подменю расположены вертикально у правой кромки экрана Их значение о...

Page 49: ...формация о специфических измерениях приводится в описаниях измерений для конкретных режимов работы устройства и технологий анализа например анализа спектра WiMAX или 3GPP см Приложение А Руководства по проведению измерений Руководство по проведению измерений анализатором спектра включает разделы которые описывают настройку полосы пропускания полосы видеосигнала развертки и функции аттенюатора Напр...

Page 50: ...работы 3 2 PN 10580 00340R ред А РЭ MS2720T На рисунке 3 1 показан пример спектрограммы на экране Рисунок 3 1 Пример спектрограммы ООО Техэнком Контрольно измерительные приборы и оборудование www tehencom com ...

Page 51: ...и подменю имеют переключаемые значения On Off Low High Текущее состояние параметра индицируется подчеркиванием Нажмите клавишу подменю для переключения значения 3 Используйте клавиши стрелки цифровую клавиатуру или поворотную кнопку для изменения значений выбора значения из списка или ввода имен файлов Выбор режима работы Spectrum Master 1 Нажмите клавишу Shift затем клавишу Mode 9 для отображения...

Page 52: ...ран анализатора спектра на стр 2 20 Выбор стандарта сигнала Нажмите клавишу главного меню Freq частота Нажмите клавишу подменю Signal Standard стандарт сигнала В появившемся окне Signal Standards выберите стандарт сигнала и нажмите Enter или поворотную кнопку Нажмите клавишу подменю Channel для конфигурации канала в редакторе Channel Editor Примечание Список стандартов сигнала можно обновлять с по...

Page 53: ...матическое ослабление увязывающую установку аттенюатора и опорного уровня чтобы лишний раз убедиться что гармоники и паразитные сигналы в измерении не присутствуют Функции аттенюатора описаны в Руководстве по проведению измерений анализатором спектра Установка диапазона амплитуд и шкалы Данная установка относится к большинству режимов демодулятора Режим анализатора спектра не имеет эквивалента фун...

Page 54: ...ии усиления dB External Gain для компенсации ослабления dB External Loss Новое значение смещения будет отображено на приборе экрана и выполнена соответствующая подстройка опорного уровня 3 5 Настройка полосы обзора Режимы анализатора спектра анализатора интерференций и измерителя мощности i Нажмите клавишу главного меню Span или клавишу главного меню Freq а затем клавишу подменю Span ii Для выбора...

Page 55: ...ия нажмите клавишу подменю Set Default Limit установка линии по умолчанию Огибающая ограничительная линия Режимы анализатора спектра и анализатора интерференций 1 Нажмите клавишу Shift а затем клавишу Limit 6 2 Нажмите клавишу подменю Limit Upper Lower для выбора верхней Upper или нижней Lower ограничительной линии 3 Нажмите клавишу подменю Limit Envelope для отображения меню огибающей ограничител...

Page 56: ...сле того как была построена правая половина ограничительной линии ее левая часть была достроена автоматически посредством нажатия клавиши подменю Limit Advanced дополнительные возможности ограничительных линий а затем клавиша Limit Mirror зеркальное отражение ограничительной линии Рисунок 3 2 Пример сегментированной ограничительной линии ООО Техэнком Контрольно измерительные приборы и оборудование...

Page 57: ...кер Для установки маркера на максимальное значение амплитуды на экране в данный момент нажмите клавишу Peak Search Для получения дополнительных возможностей перемещения маркера нажмите клавишу подменю More Peak Options Подробнее см в руководстве по измерению с помощью анализатора спектра Повторите пункты 1 и 2 для активизации и установки других маркеров Выбор активизация и размещение дельта маркер...

Page 58: ...анных другого маркера необходимо этот маркер выбрать Рисунок 3 4 Маркеры с таблицей Для изменения маркера отображаемого в большой таблице маркеров необходимо активизировать нужный маркер посредством выбора его в окне Select Marker Если необходимо активизировать дельта маркер без изменения его положения сначала выберите его опорный маркер На клавише подменю Delta будет выделена позиция On что будет...

Page 59: ...енняя память Нажмите клавишу Set Location установить место записи файлов Нажмите клавишу подменю Change Type Setup JPG изменить тип для выбора типа сохраняемой информации настройки измерения экран Нажмите клавишу подменю Measurement Введите имя файла с помощью клавиш с буквами и нажмите Enter Подробнее см в главе 4 Управление файлами 3 10 Master Software Tools Программное обеспечение Anritsu Maste...

Page 60: ...Начало работы 3 12 PN 10580 00340R ред А РЭ MS2720T ООО Техэнком Контрольно измерительные приборы и оборудование www tehencom com ...

Page 61: ...типа файлов могут содержаться следующие записи ALL отображение всех типов файлов Setup stp Файлы настроек содержат основную информацию о приборе режиме измерения маркерах и ограничениях применяющихся при измерении Measurement spa ia cs edg wcd tds lte tdlte cdma evdo wmxd wmxe afp Файлы измерений содержат всю информацию содержащуюся в файлах настроек и данные об измерении JPEG jpg Limit Lines lim ...

Page 62: ...менем ACPR то выполнение функции Save Measurement As приведет к сохранению следующих измерений в файлах ACPR_ 1 ACPR_ 2 и т д Имя файла для сохранения измерений может быть изменено с помощью диалогового окна Save рис 4 1 Сохранить измерение Нажмите клавишу подменю Save Measurement сохранить измерение и введите имя файла Тип файла по умолчанию соответствует измерениям а расширение файла устанавлива...

Page 63: ...е см в разделе Меню Save на стр 4 10 и в разделе Меню Save Location на стр 4 11 Рисунок 4 1 Диалоговое окно Save Клавиши для быстрого ввода имен файлов Клавиши Quick Name под клавиатурой на рис 4 1 позволяют вводить заготовки названий для часто используемых имен файлов в которые записываются результаты измерений Для редактирования этих клавиш нажмите клавишу Shift затем клавишу File 7 Нажмите Save...

Page 64: ...рав тип файлов которые следует отобразить Подробнее см в разделе Типы файлов на стр 4 1 Вызов результатов измерения В меню File нажмите клавиши подменю Recall Measurement выберите необходимое измерение с помощью сенсорного экрана поворотной кнопки или клавиш со стрелками вверх вниз затем нажмите Enter Вызов настройки Нажмите клавишу подменю Recall Подтвердите что тип файла Setup или все типы файло...

Page 65: ...к в любой порт USB типа А прибора Spectrum Master В главном меню File нажмите клавишу подменю Copy На экране отображаются подменю Copy и диалоговое окно Copy Выберите файл ы для копирования Для выбора нескольких файлов сначала выделите первый затем нажмите клавишу Select or De Select чтобы удержать выделение файла Файл будет помечен синим Повторите данную операцию для всех файлов подлежащих копиро...

Page 66: ...жмите клавишу Copy для копирования файлов на флеш накопитель Рисунок 4 3 Диалоговое окно Copy Примечание Чтобы свернуть развернуть папки используйте клавиши со стрелками влево вправо ООО Техэнком Контрольно измерительные приборы и оборудование www tehencom com ...

Page 67: ...ишу Select or De Select Выделенный файл будет отмечен синим Нажмите клавишу Delete а затем Enter для удаления выбранного файла Диалоговое окно Delete Для открытия диалогового окна Delete нажмите клавишу подменю Delete рис 4 4 Подменю позволяют отсортировать файлы по типу имени и дате сохранения Подробнее см раздел Меню Delete на стр 4 17 Рисунок 4 4 Диалоговое окно Delete ООО Техэнком Контрольно и...

Page 68: ...виши File 7 Карты меню как правило отображают все возможные клавиши подменю несмотря на то что некоторые клавиши присутствуют на экране прибора только при определенных обстоятельствах см описание меню на следующих страницах Рисунок 4 5 Обзор меню File ООО Техэнком Контрольно измерительные приборы и оборудование www tehencom com ...

Page 69: ...авиши подменю позволяет отобразить Меню Save стр 4 10 Измерения можно сохранить во внутреннюю память или на USB флеш накопитель С помощью сенсорной клавиатуры пользователь может ввести имя сохраняемого измерения настройки или файла JPEG По умолчанию измерения сохраняются в папку user во внутреннюю память Указание путей для сохранения файлов осуществляется с помощью меню Save Location см стр 4 11 S...

Page 70: ...ной клавиши подменю позволяет открыть Меню Save Location см стр 4 11 Change Type Нажатие данной клавиши подменю открывает окно со списком доступных типов файлов и меню File Type Рисунок 4 7 Меню Save Меню File Type Последовательность нажатия клавиш Shift File Save 7 Change Type JPEG Capture Full Graph Only Нажатие данной клавиши подменю позволяет переключаться между типами файлов Full полный и Gra...

Page 71: ...call стр 4 13 Sort By Name Date Type Нажатие данной клавиши позволяет отсортировать папки по имени типу или дате Sort Order Asc Desc Отображает названия папок по возрастанию Asc или убыванию Desc Create Folder Данная клавиша позволяет создать новую папку в выделенном месте или папке На экране отобразится диалоговое окно создания папки в котором можно ввести ее название Set Location Данная клавиша ...

Page 72: ...ертки Установка данной клавиши подменю в положение On позволит сохранить измерение во внутреннюю память после завершения текущей развертки Если Save Then Stop установлено в положение Off сохранение будет выполняться после каждой развертки Save Then Stop Установка данной клавиши подменю в режим On позволит остановить развертку после сохранения измерения Если данная клавиша находится в положении Off...

Page 73: ...позиции выбранной клавишей Sort By File Type Нажатие данной клавиши позволяет выбрать тип отображаемых файлов Тип файла можно изменить с помощью клавиш со стрелками вверх вниз или поворотной кнопки Для подтверждения выбора нажмите клавишу Enter Некоторые примеры типов показаны ниже Setup stp Файлы типа stp содержат основную информацию о приборе детали настройки в определенном режиме измерения данн...

Page 74: ...MS2720T Диалоговое окно Recall Выберите папки или файлы с помощью клавиш со стрелками вверх вниз поворотной кнопки или сенсорного экрана Рисунок 4 13 Диалоговое окно Recall ООО Техэнком Контрольно измерительные приборы и оборудование www tehencom com ...

Page 75: ...ых файлов Тип файла можно изменить с помощью клавиш со стрелками вверх вниз поворотной кнопки или сенсорного экрана Для подтверждения выбора нажмите клавишу Enter Refresh Directories Нажатие данной клавиши позволяет обновить экран Scroll Scr Dst Нажатие данной клавиши позволяет воспользоваться функцией прокрутки в исходной папке Scr верхняя панель или в папке назначения Dst нижняя панель См рис 4 ...

Page 76: ...Управление файлами 4 16 PN 10580 00340R ред А РЭ MS2720T Диалоговое окно Copy Рисунок 4 15 Диалоговое окно Copy ООО Техэнком Контрольно измерительные приборы и оборудование www tehencom com ...

Page 77: ... ALL все Measurement измерение Setup настройка Limit Lines ограничительные линии или Jpeg Тип файла можно изменить с помощью клавиш со стрелками вверх вниз или поворотной кнопки Для подтверждения выбора нажмите клавишу Enter Подробнее см в разделе Типы файлов на стр 4 1 Select or Deselect Использование данной клавиши помогает выделить или снять выделение файла файлов или папки папок которые необхо...

Page 78: ...Управление файлами 4 18 PN 10580 00340R ред А РЭ MS2720T Диалоговое окно Delete Рисунок 4 17 Диалоговое окно Delete ООО Техэнком Контрольно измерительные приборы и оборудование www tehencom com ...

Page 79: ... описываются системные операции Spectrum Master Описание других меню Sweep развертка Measure измерение Trace кривая измерения Limit ограничение приводится в руководствах по проведению измерений Приложение А ООО Техэнком Контрольно измерительные приборы и оборудование www tehencom com ...

Page 80: ...System Карты меню как правило отображают все возможные клавиши подменю несмотря на то что некоторые клавиши присутствуют на экране прибора только при определенных обстоятельствах см описание меню на следующих страницах Обратите внимание что меню отмеченные цифрами в круге показаны на рис 5 2 Меню System карта 1 Рисунок 5 1 Меню System часть 1 ООО Техэнком Контрольно измерительные приборы и оборудо...

Page 81: ...Системные операции РЭ MS2720T PN 10580 00340R ред А 5 3 Меню System карта 2 Рисунок 5 2 Меню System часть 2 ООО Техэнком Контрольно измерительные приборы и оборудование www tehencom com ...

Page 82: ...режима на стр 2 17 Для прекращения процедуры нажмите Esc для продолжения Enter На экране отобразится список пройденных тестов В случае неудачного прохождения какого либо из тестов то все из выполненных тестов будут помечены как Pass прошел или Fail не прошел Если процедура тестирования завершилась неудачно то необходимо обратиться в ближайший центр обслуживания Anritsu см раздел Обращение в Anrits...

Page 83: ...Tools Если используемый режим не имеет перевода на другой язык то по умолчанию используется английский Для принятия изменений нажмите Enter нажатие Esc позволяет вернуться в нормальный режим работы без изменения настройки Помимо этого допускается редактирование любого из доступных языков кроме английского для обеспечения лучшего перевода на местный язык Внимание В результате выполнения процедуры с...

Page 84: ... центральная частота или смещение мощности или в которых текущая настройка центральной частоты или смещения мощности находятся за пределами нового измерения Set Remote Access Password Нажатие данной клавиши подменю открывает окно для ввода пароля Password рис 5 6 и меню ввода текста Введите желаемый пароль Допускается использование символов _ и букв верхнего и нижнего регистра Для принятия введенн...

Page 85: ...м режиме одновременно может только один пользователь Пароль сначала устанавливается в прибор а затем используется в MST При запросе в MST введите пароль в соответствующем окне Окно для ввода пароля показанное на рис 5 6 может отличаться от фактического изображения на экране вашего прибора Рисунок 5 6 Окно ввода пароля для работы в дистанционном режиме Пароль можно отменить или сбросить с помощью п...

Page 86: ...ния кнопки On Off на передней панели When DC Applied Нажатие данной клавиши подменю позволяет установить прибор в режим автоматического включения при подаче постоянного напряжения на соответствующий разъем поз 5 на рис 2 3 на стр 2 4 Подробнее см на стр 3 11 Back Нажатие клавиши Back позволяет вернуться к меню System Options 2 2 стр 5 6 Рисунок 5 7 Меню Power On ООО Техэнком Контрольно измерительн...

Page 87: ...s Нажатие данной клавиши устанавливает цветовое решение по умолчанию и используется при работе в нормальных условиях освещенности Измерительная сетка черная или темно серая и фон черный Black White Отображение данных на экране в черно белом режиме Черный цвет используется для вывода данных белый для фона Используется для печати и просмотра в условиях яркого солнца Night Vision Нажатие данной клави...

Page 88: ...чении Spectrum Master посредством нажатия и удерживания клавиш System 8 On до появления экрана заставки Anritsu Update Firmware Нажатие данной клавиши позволяет выполнить обновление операционной системы прибора с помощью карты памяти USB Нажмите клавишу Enter для запуска обновления нажатие Esc позволяет вернуться в нормальный режим работы без выполнения процедуры обновления Подробнее см на стр 5 1...

Page 89: ... тестов для проверки аппаратных компонентов прибора используемых в выбранном режиме Некоторые тесты для проверки функционирования прибора в конкретном режиме работы самотестирование приложения включают дополнительные тесты для которых появляются дополнительные клавиши подменю Например после выполнения теста для оценки функционирования прибора в режиме анализатора спектра при наличии опции Следящий...

Page 90: ...ране Что потребуется Персональный компьютер с доступом к Internet Отформатированная нужным образом карта памяти USB Примечание Anritsu рекомендует переформатировать имеющуюся карту памяти USB перед использованием ее в процедуре обновления Spectrum Master с адаптером питания Способы загрузки файлов обновления Файл обновления можно получить на странице изделия Spectrum Master или перейти напрямую к ...

Page 91: ...го обеспечения через USB Обновление программного обеспечения через USB После установки карты памяти выполните следующую процедуру 1 Нажмите Shift 8 2 Нажмите клавишу подменю System Options 3 Нажмите клавишу подменю Reset 4 Нажмите клавишу подменю Update Firmware 5 Нажмите клавишу главного меню Load Firmware 6 Нажмите клавишу подменю Update Application Firmware 7 Нажмите поворотную кнопку чтобы выб...

Page 92: ...Системные операции 5 14 PN 10580 00340R ред А РЭ MS2720T ООО Техэнком Контрольно измерительные приборы и оборудование www tehencom com ...

Page 93: ... установить снаружи антенну и обеспечить отсутствие помех Помимо опции 31 также требуется подключение антенны GPS Шифры антенн GPS предлагаемых Anritsu 1 2000 1528 R кабель 25 футов 2 2000 1652 R кабель 1 фут Включение функции GPS 1 Подключите антенну GPS к разъему GPS в верхней части прибора Spectrum Master 2 Нажмите клавишу Shift затем клавишу System 8 На экране отобразится меню System 3 Нажмите...

Page 94: ...р опорной частоты запускает процедуру корректировки своей частоты чтобы соответствовать стандарту GPS После настройки внутренней частоты в соответствии со стандартом GPS в меню Status слева от экрана измерения отображается состояние GPS High Accuracy Если функция GPS не активизирована в меню Status для опорного источника отображается состояние Internal Standard Accuracy внутренняя стандартная точн...

Page 95: ...е источника питания на 3 3 В или 5 В в зависимости от используемого приемника GPS По умолчанию напряжение для антенны GPS установлено на 3 3 В чтобы избежать случайного повреждения антенн GPS с более низким напряжением Reset Клавиша Reset устанавливает количество отслеживаемых спутников на 0 и удаляет все данные альманаха а также сохраненные координаты Процесс поиска и захвата спутников запускаетс...

Page 96: ... спутников ионосфере и специальные системные сообщениях При холодном старте приемник GPS не имеет навигационных данных поэтому у приемника отсутствует текущий альманах Для установления первого местоположения готовый альманах не требуется однако наличие альманаха существенно сокращает время необходимое для определения местоположения Antenna Status OK Антенна подключена и функционирует правильно Sho...

Page 97: ...ение к прибору Обновление встроенного программного обеспечения 7 2 Обзор Master Software Tools Программа Master Software Tools компании Anritsu это совместимая с операционной системой Microsoft Windows Windows 2000 и выше программа предназначенная для передачи результатов измерений включая маркеры и ограничительные линии на ПК с целью их последующего редактирования MST не поддерживается более ранн...

Page 98: ...езультатов измерения из памяти прибора в ПК для хранения и анализа 2 Захват текущих кривых для просмотра и сохранения в ПК 3 Загрузка сохраненных кривых из ПК в прибор 4 Сравнение нескольких кривых и помощью функций перемещения и наложения только для измерений в режиме анализатора спектра 5 Внесение изменений в список кабелей антенн и стандартов сигналов 6 Математические функции с кривыми 7 Конвер...

Page 99: ...ение и изменение ограничительных линий и маркеров 2 Добавление удаление и изменение заголовков и подзаголовков Добавление данных об операторе и объекте 3 Создание отчетов с использованием кривых и экспорт файлов csv для дальнейшей обработки 4 Экспорт результатов измерения в виде графических файлов формат jpg Рисунок 7 2 Импортированные графические данные с ограничительной линией и дельта маркером ...

Page 100: ... наборе графиков 1 Возможность отображения кривых в виде каскадной диаграммы 3D или ролика в формате avi 2 Просмотр трехмерных изображений во временной и частотной области 3 Добавление маркеров для выделения данных Рисунок 7 3 Данные анализа интерференции в виде каскадной диаграммы верхнее изображение и спектрограммы нижняя ООО Техэнком Контрольно измерительные приборы и оборудование www tehencom ...

Page 101: ...го подключения Ethernet Возможность обновления программного обеспечения прибора до самых последних версий доступных на http www anritsu com Рисунок 7 4 Использование инструмента дистанционного подключения к прибору в сети Контекстные меню Контекстные меню служат в качестве ярлыков к командам которые также доступны на выпадающих меню и панели инструментов 1 Доступ к контекстным меню осуществляется ...

Page 102: ...дключение к прибору Для подключения к прибору используйте кабель USB из комплекта поставки измерительного прибора Подсоедините кабель USB к порту USB A компьютера и порту USB mini B измерительного прибора Включите измерительный прибор Запустите программу Master Software Tools Разверните меню Connection и щелкните по Connect USB установив тем самым связь с измерительным прибором 7 6 Обновление встр...

Page 103: ...ая развертка 90 Нанесение данных о покрытии на карту 431 Анализатор АМ ЧМ ИМ 509 Руководство по измерению с помощью анализатора спектра 10580 00349 Следящий генератор 809 813 или 820 Руководство по измерению с помощью следящего генератора 10580 00339 Встроенный измеритель мощности 29 Высокоточный измеритель мощности 19 Руководство по измерению с помощью измерителя мощности 10580 00240 Анализатор с...

Page 104: ...та Master Software Tools анализ кривых и отчеты Line Sweep Tools поддержка PIM MapMaster поддержка функции нанесения на карту 2300 498 2300 530 2300 532 Документация по работе с переносными приборами компакт диск 10920 00060 Дополнительные документы находятся под вкладкой Library на странице каждого из изделий Anritsu Актуальная информация по изделиям доступна на сайте Anritsu http www anritsu com...

Page 105: ...лов пользователя из внутренней памяти на стр В 3 Скрытие частоты Опция 7 позволяет скрывать отображаемые значения частоты Значения частоты отображаемые на экране и в меню заменяются символами Нажмите клавишу подменю System Options затем Reset Установите на клавише подменю Frequency Blanking состояние On выделяется подчеркиванием Настройка Frequency Blanking на Off переведет настройки прибора на за...

Page 106: ...EPROM В этом типе памяти хранится номер модели серийный номер калибровочные данные для прибора Также здесь хранятся операционные параметры установленные пользователем такие как частотный диапазон После выполнения процедуры главного сброса все рабочие параметры сохраненные в ЭСППЗУ устанавливаются на заводские значения по умолчанию Оперативная память RAM Это энергозависимая память используемая для ...

Page 107: ...я стандартным удалением файлов и не подразумевает перезапись имеющейся информации 6 Нажмите клавишу ENTER для завершения процедуры главного сброса 7 Прибор выполнит перезагрузку процедура сброса будет завершена Примечание Главный сброс Master Reset можно выполнить посредством включения Spectrum Master On нажимая при этом клавишу System 8 Удерживайте эти клавиши до появления экрана заставки Эта опе...

Page 108: ...жмите клавишу подменю Save 4 Нажмите клавишу подменю Change Save Location затем выберите USB диск с помощью поворотной кнопки или стрелок 5 Нажмите клавишу подменю Set Location 6 Нажмите Esc для очистки диалогового окна Save Теперь файлы будут по умолчанию сохраняться на USB флеш накопитель Примечание Не все USB устройства для хранения данных предлагаемые на рынке совместимы с прибором Многие устр...

Page 109: ...9 Мощность ВЧ сигнала на входе слишком большая Отключите сигнал или уменьшите его мощность либо добавьте дополнительный аттенюатор Иногда перегрузку могут вызвать даже присутствующие внеполосные частоты Для того чтобы уменьшить нежелательные помехи может понадобиться добавить внешний полосовой фильтр см раздел принадлежностей со списком доступных полосовых фильтров от Anritsu Часто внеполосные час...

Page 110: ...стоты которые находятся в частотном диапазоне выбранной антенны Также смотрите описание Master Software Tools в части касающейся создания и загрузки файлов описания антенн Minimum permitted Sweep time is 50 μs минимальное допустимое время развертки 50 мкс Попытка установить время развертки менее 50 мкс Unable to add additional limit points 41 is the maximum невозможно добавить дополнительные преде...

Page 111: ...я маркера который не включен Чтобы использовать эту функцию включите соответствующий маркер или переключитесь на маркер который уже включен Triggering valid only in Zero Span запуск возможен только при нулевой полосе обзора Внешний запускающий сигнал можно быть использован только при нулевой полосе обзора Cannot change Modes for Recalled Inactive Traces невозможно изменить режим для восстановленны...

Page 112: ...ятора Система определила что внутренняя температура прибора достигла значений при которых должен работать вентилятор охлаждения но не может определить работает ли вентилятор на самом деле Очень важно чтобы входное и выходное отверстия вентилятора не были закрыты посторонними предметами Охлаждающий вентилятор изменяет свою скорость в зависимости от внутренней температуры прибора Вентилятор включает...

Page 113: ...C ON или MASTER RESET System ON ПРЕДУПРЕЖДЕНИЕ MASTER RESET System ON удаляет все сохраненные пользовательские настройки и кривые измерения и устанавливает заводские параметры Если состояние ошибки сохраняется свяжитесь с местным центром Anritsu Copy Failed Please check External USB Memory ошибка копирования Проверьте внешний USB диск Сбой при попытке скопировать сохраненные пользователем данные н...

Page 114: ...Сообщения об ошибках C 6 PN 10580 00340R ред А РЭ MS2720T ООО Техэнком Контрольно измерительные приборы и оборудование www tehencom com ...

Page 115: ...бы во время загрузки задействовать Ethernet порт прибора на динамический с помощью протокола DHCP или статический IP адрес В зависимости от имеющихся условий Ethernet порт может оставаться задействованным при переходе с динамического адреса на статический обратном переходе со статического адреса на динамический а также при временном отключении от сети Ethernet Если Ethernet порт прибора не активир...

Page 116: ...том нажмите контекстные клавиши System Options и Ethernet Config IP адрес отобразится так как показано на рисунке D 1 Фактическое изображение на экране вашего прибора может отличаться от приведенного на рисунке ниже Рисунок D 1 Присвоение IP адреса с использованием протокола DHCP ООО Техэнком Контрольно измерительные приборы и оборудование www tehencom com ...

Page 117: ...игурация Ethernet Нажмите клавишу Ethernet Config для отображения меню Ethernet и открытия диалогового окна Ethernet Editor для ввода IP адреса вручную рис D 2 Рисунок D 2 Настройка IP адреса вручную ООО Техэнком Контрольно измерительные приборы и оборудование www tehencom com ...

Page 118: ...авиш со стрелками вверх вниз или поворотной кнопки Завершите ввод данных клавишей Enter или нажмите клавишу Esc для возврата без изменений Field поле IP адрес G Way шлюз Sub маска подсети нажмите данную клавишу для выбора поля IP протокола которое необходимо редактировать First Octet первые 8 бит выделение курсором первой самой левой колонки редактируемого поля Second Octet вторые 8 бит выделение ...

Page 119: ...й адрес Будучи установленным он всегда остается тем же самым и надо заботиться чтобы не было конфликтов с другими устройствами в сети При необходимости присвоить устройству статический IP адрес обратитесь к администратору сети Выбор случайного статического IP адреса может привести к тому что в сети уже имеется устройство с таким же адресом и вызвать другие конфликты Для использования статического ...

Page 120: ...да в командной строке команды ipconfig на экране компьютера отобразится информация о настройках сети и параметрах сетевого подключения Ниже приводится пример типовой информации отображаемой на экране после ввода команды ipconfig Примечание Листинг ipconfig не сообщает получена ли информация от DHCP сервера или взята из настроек статического IP Y ipconfig Windows 2000 IP Configuration Ethernet adap...

Page 121: ...ему сигнала Если нет то в качестве ответа будет прислано сообщение request timed out означающее что от этого IP адреса не было ответа Y ping 172 26 202 172 Pinging 172 26 202 172 with 32 bytes of data Reply from 172 26 202 172 bytes 32 time 10ms TTL 128 Reply from 172 26 202 172 bytes 32 time 10ms TTL 128 Reply from 172 26 202 172 bytes 32 time 10ms TTL 128 Reply from 172 26 202 172 bytes 32 time ...

Page 122: ...р интерференций Опция 25 Сканер каналов Опция 27 Выход ПЧ в нулевой полосе обзора Опция 89 Ждущая развертка Опция 90 Генератор непрерывных сигналов Опция 28 Anritsu Company 490 Jarvis Drive Morgan Hill CA 95037 2809 USA Шифр компонента 10580 00231 Редакция В Опубликовано август 2009 Copyright 2009 Anritsu Company ООО Техэнком Контрольно измерительные приборы и оборудование www tehencom com ...

Page 123: ...itsu Все рисунки спецификации и информация содержащиеся в данном руководстве являются собственностью компании Anritsu и любое несанкционированное использование или распространение данных рисунков спецификаций и информации запрещено запрещается их полное или частичное воспроизведение или копирование или использование в целях производства или продажи оборудования или программного обеспечения без пре...

Page 124: ...анные предупреждающие символы используются внутри или на оборудовании рядом с местом эксплуатации и предоставляют информацию о необходимых мерах безопасности и предосторожности Важно чтобы пользователь четко понимал значения символов и предпринимал необходимые меры предосторожности до того как он приступит к работе с оборудованием Указанные символы не обязательно будут использоваться на всем обору...

Page 125: ...ра должно проводиться только квалифицированным обслуживающим персоналом Прибор содержит компоненты находящиеся под высоким напряжением работа с которыми может привести к серьезному поражению электрическим током если она выполняется необученным специалистом Кроме того существует опасность повреждения прецизионных частей Внимание Электростатический разряд может стать причиной повреждения высокочувст...

Page 126: ...1 Измерение мощности в канале для GSM 2 12 2 13 Измерение мощности в соседнем канале 2 13 2 14 Измерение внеполосного паразитного излучения 2 14 2 15 Внутриполосные внеканальные измерения 2 15 2 16 Измерения внутриполосного паразитного излучения 2 16 2 17 АМ ЧМ однополосная модуляция 2 17 2 18 Измерение отношения мощности сигнала на несущей к помехе C I 2 18 2 19 Меню режима анализатора спектра 2 ...

Page 127: ... 48 2 28 Меню Limit Ограничение 2 49 Меню Limit Edit Редактирование 2 50 Меню Limit Edit Редактирование продолжение 2 51 Меню Limit Move Перемещение ограничения 2 52 Меню Limit Envelope Ограничительная огибающая 2 53 Меню Limit Advanced Дополнительные возможности ограничений 2 55 2 29 Меню Options Дополнительные опции 2 56 2 30 Другие меню 2 57 Глава 3 Анализатор интерференций 3 1 3 1 Введение 3 1...

Page 128: ...ted Sweep Ждущая развертка 3 37 3 15 Меню Measure Измерение 3 38 3 16 Меню Trace Траектория 3 39 Меню Trace A Ops Операции с траекторией А 3 40 Меню Trace B Ops Операции с траекторией В 3 41 Меню Trace С Ops Операции с траекторией С 3 42 3 17 Меню Limit Ограничение 3 43 Меню Limit Edit Редактирование 3 44 Меню Limit Edit Редактирование продолжение 3 45 Меню Limit Move Перемещение ограничения 3 46 ...

Page 129: ... 4 12 Меню Sweep Развертка 4 14 4 13 Меню Measure Измерение 4 14 4 14 Меню Trace Траектория 4 14 4 15 Меню Limit Ограничение 4 14 4 16 Другие меню 4 14 Глава 5 Генератор непрерывных сигналов Опция 28 5 1 5 1 Введение 5 1 Требуемое оборудование 5 1 5 2 Процедура 5 2 Приложение А Сообщения об ошибках А 1 Введение A 2 Сообщения об ошибках в режиме анализатора интерференций A 3 Сообщения об ошибках в ...

Page 130: ...оделях прибора Информацию о доступных опциях см в Технических спецификациях вашего прибора 1 2 Выбор режима измерения Нажмите кнопку Shift а затем Mode 9 на экране откроется диалоговое окно выбора режима Mode Selector Выберите необходимый режим измерения и нажмите Enter или На приборе Site Spectrum и Cell Master нажмите клавишу Menu и выберите необходимый режим измерения Анализатор спектра РИ Шифр...

Page 131: ...1 2 Шифр 10580 00231 Ред В Анализатор спектра РИ ООО Техэнком Контрольно измерительные приборы и оборудование www tehencom com ...

Page 132: ...тупные в режиме анализатора спектра 2 2 Общие настройки измерения Более подробно о настройке частоты полосы обзора амплитуды GPS ограничительных линий маркеров и управлении файлов см в Руководстве пользователя Примечание В большинстве случаев информацию и параметры можно ввести с помощью аппаратной клавиатуры клавиш со стрелками или вращающейся ручки Числовая клавиатура позволяет вводить информаци...

Page 133: ...ния прибор выберет следующее более высокое значение полосы пропускания В случае ввода значения превышающего максимально допустимую полосу пропускания прибор установит эту максимально допустимую полосу пропускания Полоса видеосигнала может быть установлена двумя способами вручную или автоматической привязкой Автоматическая привязка полосы видеосигнала выполняет привязку полосы видеосигнала к полосе...

Page 134: ...ния поскольку для каждой точки отображения измеряется только одна точка на данной частоте Этот метод рекомендуется использовать когда скорость имеет первостепенное значение а возможность пропустить узкий пик не так важна Квазипиковый Quasi peak При выборе данного метода становятся доступными полосы пропускания и полосы видеосигнала 200 Гц 9 кГц и 120 кГц Данный метод детектирования разработан в со...

Page 135: ...ждущей развертки позволяет просматривать сигнал во временной и частотной области Нажатие клавиши Gated Sweep Setup разбивает экран на две графические области частотная область сверху и временная область снизу Кроме этого отображается меню Gate Setup которое позволяет установить параметры ждущей развертки полярность задержка продолжительность строба и время нулевой полосы обзора В отношении экрана ...

Page 136: ...ерение то результат измерения может быть ошибочным полученное значение слишком большим в зависимости от уровня шума При выполнении широкополосных измерений в измерение попадает больше шума В случае с узкой полосой в фильтр полосы пропускания приходит меньше шума и измерение выполняется с большей точностью Если полоса пропускания уже уровень шума упадет на экране анализатора спектра С падением уров...

Page 137: ... клавиши подменю Min Sweep Time Введите время развертки в диапазоне от 10 микросекунд до 600 секунд Если минимальное время развертки введенное пользователем меньше значения при котором возможно получение точных результатов прибор будет использовать значение которое обеспечит получение точных результатов Независимо от настройки минимального времени развертки прибор никогда не будет выполнять развер...

Page 138: ...ализатор спектра Рис 2 2 Предусилитель выключен Рис 2 3 Предусилитель включен Анализатор спектра РИ Шифр 10580 00231 Ред В 2 7 ООО Техэнком Контрольно измерительные приборы и оборудование www tehencom com ...

Page 139: ...ра Примечание Выберите антенну из имеющегося стандартного списка или создайте пользовательскую антенну с помощью функции Antenna Editor программы Master Software Tools и загрузите информацию об антенне в список антенн 3 Подключите антенну к порту RF In 4 Нажмите клавишу главного меню Freq нажмите клавишу подменю Center Freq и введите значение центральной частоты 5 Нажмите клавишу главного меню Spa...

Page 140: ...гии в напряженность поля Альтернативной мерой напряженности поля является плотность мощности Pd E2 120π где E напряженность поля в В м Pd плотность потока энергии в Вт м2 Плотность потока энергии в точке Pd PtGt 4πr2 Данное равенство действительно в условиях дальней зоны где электрические и магнитные поля соотносятся по характеристическому импедансу свободного пространства где Pd плотность потока ...

Page 141: ...ной клавиатуры клавиш со стрелками или вращающейся ручки В случае ввода частоты с помощью клавиатуры названия на клавишах подменю изменяются на GHz MHz kHz и Hz Нажмите клавишу с необходимой единицей измерения Нажатие клавиши Enter имеет тот же самый эффект что и нажатие клавиши подменю MHz 3 Если на этапе шага 1 был подключен аттенюатор нажмите клавишу главного меню Amplitude затем нажмите клавиш...

Page 142: ... указанные допустимые пределы указывают на неисправности в системе которые могут быть в усилителях мощности или в цепях фильтра Измерения мощности в канале можно использовать в качестве проверки работоспособности передатчика соответствия государственным нормам или поддержания общего уровня помех в системе на минимальном уровне Прибор позволяет устанавливать частоту и полосу обзора для многих станд...

Page 143: ...есь что RBW Auto и VBW Auto находятся в положении On 5 Нажмите клавишу главного меню Freq затем нажмите клавишу подменю Signal Standard С помощью вращающейся ручки или клавиш со стрелками Вверх Вниз выделите для данного измерения стандарт GSM900 и нажмите Enter 6 Нажмите клавишу подменю Channel и введите номер канала с помощью клавиатуры клавиш со стрелками или вращающейся ручки Например установит...

Page 144: ...W Auto установлены в положение On 6 Параметры измерения можно задать двумя способами Если стандарт сигнала и канал известны нажмите клавишу главного меню Freq и установите стандарт сигнала нажмите клавишу подменю Channel для сигнала который будет измеряться затем перейдите к п 12 Если стандарт сигнала и канал неизвестны выполните процедуры в п п 7 12 7 Нажмите клавишу главного меню Freq нажмите кл...

Page 145: ...авного меню BW затем с помощью клавиш подменю RBW и VBW установите полосу пропускания на 3 kHz а полосу видеосигнала на 300 Hz 7 Нажмите клавишу главного меню Marker затем нажмите клавишу подменю Marker 123456 и выберите маркер 1 Активный маркер выделяется подчеркиванием 8 Нажмите клавишу подменю On Off чтобы активизировать маркер С помощью клавиш со стрелками клавиатуры или вращающейся ручки пере...

Page 146: ...олосы системы но за пределами канала передачи Эти измерения включают внутриполосные паразитные излучения и измерение мощности в соседнем канале также называемый подрост спектра Существуют строгие требования относительно уровня помехи которую передатчик может вносить в соседние каналы Для того чтобы определить соответствует ли уровень паразитного излучения допустимым значениям необходимо указать дв...

Page 147: ...нь на 20 dBm 5 Нажмите клавишу подменю RL Offset и установите смещение опорного уровня на 30 dB для компенсации потерь в аттенюаторе 6 Нажмите клавишу подменю Auto Atten для включения ослабления 7 Нажмите клавишу главного меню BW затем с помощью клавиш подменю RBW и VBW установите полосу пропускания на 10 kHz а полосу видеосигнала на 300 Hz 8 Нажмите клавишу главного меню Marker затем нажмите клав...

Page 148: ... сигнала Для сигналов верхней боковой полосы USB и нижней боковой полосы LSB отрегулируйте сигнал с помощью Beat Freq Osc По умолчанию частота BFO установлена на ноль что означает что обратная несущая располагается точно на частоте демодуляции Клавиша подменю Beat Freq Osc позволяет регулировать гетеродин с целью настройки сигнала в полосе обзора 10000 Гц 5 Для запуска измерения нажмите клавишу по...

Page 149: ...лавишу подменю Channel выберите рабочий канал измеряемой точки доступа и нажмите Enter 3 Нажмите клавишу Shift затем клавишу Measure 4 и клавишу подменю C I 4 Нажмите клавишу подменю Center Freq и введите необходимую частоту если стандарт сигнала и канал не были выбраны в меню Frequency 5 При необходимости нажмите клавишу подменю Span и установите полосу обзора соответствующую измеряемому сигналу ...

Page 150: ...щей к помехе готовность к измерению несущей Рис 2 6 несущая измерена Рис 2 7 результаты измерения Рис 2 8 Рис 2 6 Готовность к измерению несущей Рис 2 7 Несущая измерена Анализатор спектра РИ Шифр 10580 00231 Ред В 2 19 ООО Техэнком Контрольно измерительные приборы и оборудование www tehencom com ...

Page 151: ...Анализатор спектра Рис 2 8 Результаты измерения 2 20 Шифр 10580 00231 Ред В Анализатор спектра РИ ООО Техэнком Контрольно измерительные приборы и оборудование www tehencom com ...

Page 152: ...ежиме анализатора спектра и связанных с ними подменю Подменю перечисляются в том порядке в котором они появляются на экране сверху вниз под каждым главным меню Только для моделей Cell Site и Spectrum Master Только для Опции 89 Рис 2 9 Клавиши главного меню Анализатор спектра РИ Шифр 10580 00231 Ред В 2 21 ООО Техэнком Контрольно измерительные приборы и оборудование www tehencom com ...

Page 153: ...Анализатор спектра Только для Опции 90 Рис 2 10 Клавиши подменю Sweep 2 22 Шифр 10580 00231 Ред В Анализатор спектра РИ ООО Техэнком Контрольно измерительные приборы и оборудование www tehencom com ...

Page 154: ...Анализатор спектра Рис 2 11 Клавиши подменю Measure Анализатор спектра РИ Шифр 10580 00231 Ред В 2 23 ООО Техэнком Контрольно измерительные приборы и оборудование www tehencom com ...

Page 155: ...лизатор спектра Рис 2 12 Клавиши подменю Trace Рис 2 13 Клавиши подменю Limit 2 24 Шифр 10580 00231 Ред В Анализатор спектра РИ ООО Техэнком Контрольно измерительные приборы и оборудование www tehencom com ...

Page 156: ...Анализатор спектра Рис 2 14 Клавиши подменю Options меню System Анализатор спектра РИ Шифр 10580 00231 Ред В 2 25 ООО Техэнком Контрольно измерительные приборы и оборудование www tehencom com ...

Page 157: ... или вращающейся ручки необходимую начальную частоту Если введенное значение начальной частоты выше текущей конечной частоты конечная частота будет изменена таким образом чтобы получить полосу обзора в 10 Гц Stop Freq Нажатие клавиши главного меню Freq с последующим нажатием клавиши подменю Stop Freq позволяет ввести с помощью клавиатуры клавиш со стрелками или вращающейся ручки необходимую конечн...

Page 158: ...у или вращающуюся ручку Signal Standard Клавиши со стрелками Вверх Вниз или вращающаяся ручка позволяют выбрать стандарт сигнала для подтверждения выбора нажмите Enter После выбора стандарта сигнала прибор выполняет автоматическую подстройку центральной частоты и полосы обзора для первого канала последнего сегмента конкретного стандарта Также автоматически выполняются и другие настройки разнос час...

Page 159: ... уровней Atten Lvl Данная клавиша подменю позволяет изменить значение ослабления при помощи клавиатуры вращающейся кнопки или клавиш со стрелками RL Offset On Off Данная клавиша позволяет компенсировать наличие внешнего входного ослабления или усиления Для компенсации внешнего усилителя введите положительное значение для компенсации внешнего аттенюатора введите отрицательное значение Клавиша позво...

Page 160: ...лько шум будут как правило показывать меньшую амплитуду по сравнению с теми которые содержат дискретные сигнала Quasi peak При выборе данного метода становятся доступными полосы пропускания и полосы видеосигнала 200 Гц 9 кГц и 120 кГц Данный метод детектирования разработан в соответствии с требованиями Международного комитета по борьбе с радиопомехами CISPR Sample Данный метод является самым быстр...

Page 161: ...тем на 200 кГц и т д Full Span Нажатие данной клавиши устанавливает полосу обзора на максимальный настраиваемый спектр прибора Zero Span Данная клавиша подменю устанавливает нулевую полосу обзора В этом режиме на экране отображаются изменения амплитуды на одной частоте Данная функция часто используется в качестве простого средства мониторинга изменения мощности во времени Например если требуется и...

Page 162: ...ью клавиши подменю RBW VBW RBW VBW Данная клавиша подменю отображает соотношение между полосой пропускания и полосой видеосигнала Для изменения этого соотношения нажмите эту клавишу подменю и с помощью клавиатуры клавиш со стрелками или вращающейся ручки выберите новое соотношение По умолчанию соотношение устанавливается на 3 В случае выбора квазипикового метода детектирования соотношение RBW VBW ...

Page 163: ... данной клавиши устанавливает активный в данный момент маркер на самую высокую точку амплитуды сигнала отображаемого на экране Marker Freq to Center Перемещает частоту отмеченную активным маркером в положение центральной частоты и в центр экрана Marker to ref Level Нажатие данной клавиши устанавливает амплитуду активного в данный момент маркера в качестве опорного уровня который отображается гориз...

Page 164: ... маркера по направлению к более высоким частотам Если прибор не обнаружит пик удовлетворяющий данному требованию то маркер устанавливается в правый конец траектории Клавиша Peak Threshold позволяет указать параметры поиска пиков Delta Marker to Span Устанавливает общую ширину полосы обзора на значение дельта маркера Если дельта маркер установлен на ноль то полоса обзора устанавливается на 10 Гц Ес...

Page 165: ...отором пользователь может выбрать канал Выберите номер канала для текущего стандарта сигнала и активный маркер будет установлен на центральную частоту данного канала Если стандарт сигнала не был выбран то на экране прибора появится сообщение No standard selected Press Enter or Escape to Continue Стандарт сигнал не выбран Нажмите Enter или Escape для продолжения работы Нажатие любой из указанных кл...

Page 166: ...о для решения конкретных измерительных задач В общем случае количество точек измерения по ширине экрана превышает количество точек отображения Различные методы детектирования это различные способы выбора точки измерения которая будет отображаться в каждой точке отображения См меню Detection на стр 2 29 Min Sweep Time Данная функция позволяет установить минимальное время развертки Время развертки м...

Page 167: ...й полосе обзора Zero Span Change Trigger Position Данная клавиша подменю используется вместе с режимом видео запуска для настройки горизонтального положения на экране где будет располагаться сигнал отвечающий критерию режима видео запуска Значение можно установить в диапазоне от 0 до 100 Значение 0 помещает событие при котором происходит запуск в левый край экрана а значение 100 в правый Когда пол...

Page 168: ...lay Устанавливает начало ждущей развертки отмеченное левой синей линией на нижнем графике Gate Length Устанавливает время ждущей развертки отмеченное правой синей линией на нижнем графике Zero Span Time Данная клавиша подменю позволяет установить время полной горизонтальной развертки на графике во временной области нижний Back Возврат в меню Sweep на стр 2 35 Рис 2 26 Меню Gated Sweep в режиме ана...

Page 169: ...hannel Power на стр 2 40 ACPR Вход в меню измерения соотношения мощности в соседнем канале См меню ACPR на стр 2 41 AM FM Demod Пользователь может выбрать демодуляцию АМ узкополосной ЧМ компенсация предыскажений 300 мкс широкополосной ЧМ компенсация предыскажений 50 мкс и верхней боковой полосы или нижней боковой полосы См меню AM FM Demod на стр 2 42 C I Измерение отношения мощности сигнала на не...

Page 170: ...те Enter Back Возврат в меню Measure на стр 2 38 Рис 2 28 Меню Field Strength Меню OCC BW Занимаемый диапазон частот Последовательность клавиш Shift клавиша Measure 4 OCC BW On Off Включение выключение функции измерения занимаемого диапазона частот Method Выбор режима измерения от мощности по умолчанию или dBc выбор отображается в области для сообщений С помощью клавиатуры клавиш со стрелками или ...

Page 171: ...со стрелками Вверх Вниз изменяют частоту на величину шага частоты введенную в меню Freq на стр 2 26 Клавиши со стрелками Влево Вправо изменяют частоту на 10 от величины полосы обзора Ch Pwr Width Устанавливает ширину для мощности в канале Для ввода ширины мощности в канале воспользуйтесь клавиатурой клавишами со стрелками или вращающейся ручкой Клавиши со стрелками Вверх Вниз изменяют установленно...

Page 172: ...ню GHz MHz kHz или Hz для принятия введенного значения частоты Ch Spacing Устанавливает величину разноса частоты между основным и соседним каналами Для ввода конкретной частоты воспользуйтесь клавиатурой клавишами со стрелками или вращающейся ручкой При вводе значения с клавиатуры используйте клавиши подменю GHz MHz kHz или Hz для принятия введенного значения частоты Данное значение должно быть бо...

Page 173: ...время демодуляции для подтверждение выбора нажмите клавишу Enter Время демодуляции можно установить в диапазоне от 100 миллисекунд дл 200 секунд Прибор выполняет одну развертку за каждый период демодуляции Развертка делает паузу в течение периода демодуляции Set Demod Freq to Current Marker Freq Устанавливает частоту демодуляции на частоту текущего маркера Beat Freq Osc Устанавливает частоту биени...

Page 174: ...SS Узкополосный сигнал с изменяемой несущей Используйте данную настройку для измерения сигнала 802 11b WB FHSS Широкополосный сигнал с изменяемой несущей Используйте данную настройку для измерения сигнала 802 11а или 802 11g Broadband Используйте данную настройку для измерения сигнала в цифровом формате модуляции например CDMA и GSM Back Возврат в меню C I Min Sweep Time Устанавливает минимальное ...

Page 175: ...ю линию Recall Limit as Emission Mask Открывает папку с ограничительными линиями для выбора ограничительной линии с целью использования в качестве спектральной маски Ref Power Peak Channel Нажатие данной клавиши подменю позволяет отобразить опорную мощность Reference Power как пик Peak или канал Channel При выборе режима Channel значение опорной мощности является объединением отдельных пиков в рам...

Page 176: ...ыбрать либо удерживание текущей траектории развертки на экране или постоянное выполнение развертки и обновление отображаемых результатов измерения Эта функция применима к Траектории В или Траектории С только при условии активного состояния математических операций с участием Траектории А Trace A Operations Вызов меню Trace A Ops для выбора операций применимых к Траектории А См меню Trace A Ops на с...

Page 177: ...я каждой точки отображения за несколько разверток траектории Average A Отображение экспоненциального среднего числа траекторий определенных с помощью клавиши of Averages of Averages Установка числа траекторий для вычисления среднего отображаемого значения Число результатов для усреднения может устанавливаться в диапазоне от 1 до 65535 Back Возврат в меню Trace на стр 2 45 Рис 2 36 Меню Trace A Ops...

Page 178: ...жимым Траектории С и наоборот Max Hold В Отображение накопленного максимального значения каждой точки отображения за несколько разверток траектории Min Hold В Отображение накопленного минимального значения каждой точки отображения за несколько разверток траектории Back Возврат в меню Trace на стр 2 45 Рис 2 37 Меню Trace В Ops в режиме анализатора спектра Анализатор спектра РИ Шифр 10580 00231 Ред...

Page 179: ... отображение Траекторий А и В Relative Ref Устанавливает значение применяемое к верхней сетке для относительной шкалы которая появляется справа от графика при активизированной функции математических операций над траекториями Данное значение можно изменить с помощью вращающейся ручки клавиш со стрелками Вверх Вниз или ввода значения с помощью приборной клавиатуры и нажатия клавиши подменю dB или кл...

Page 180: ... Отображение меню Limit Move на стр 2 52 Limit Envelope Ограничительная огибающая линия очень удобная для обнаружения новых сигналов при наличии других ранее присутствовавших сигналов Функция Limit Envelope позволяет автоматически создавать верхние или нижние ограничительные линии на основе отображаемых на экране измеренных значений в режиме анализатора спектра Пример ограничительной огибающей см ...

Page 181: ...плитуде является той же что и текущая единица вертикальной амплитуды Более подробно см в разделе Подменю Add Point Клавиши со стрелками Вверх Вниз позволяют переместить амплитуду на 5 от высоты экрана Add Point Нажатие данной клавиши подменю позволяет добавить точку перегиба ограничительной линии Конкретное поведение данной клавиши подменю зависит от того какая точка перегиба активна в момент нажа...

Page 182: ...лавиши подменю удаляет активную в данный момент точку Активной становится точка расположенная слева от удаленной точки Next Point Left Нажатие данной клавиши подменю позволяет выбрать точку перегиба находящуюся слева от активной точки и сделать её активной для редактирования или удаления Каждое нажатие клавиши Next Point Left делает активной точку находящуюся слева от ранее активной точки до тех п...

Page 183: ...авиши Вверх Вниз перемещают ограничительную линию на 5 от высоты экрана Клавиши Влево Вправо перемещают ограничительную линию на 0 2 от высоты экрана или на 0 2 дБ когда шкала установлена на 10 дБ деление Move Limit Hz Нажатие данной клавиши подменю позволяет изменять частоту ограничительной линии Все точки перегиба смещаются на введенное значение Изменение значения также можно выполнять и с помощ...

Page 184: ...ие если выбрано верхнее ограничение Upper Limit Lower Offset Нижнее смещение если выбрано нижнее ограничение Lower Limit Данная клавиша подменю используется для определения расстояния на котором будут размещены верхняя и нижняя огибающая от измеренного сигнала Диапазон 100 дБ Для верхней огибающей значение как правило будет положительным если необходимо разместить огибающую над сигналом Для нижней...

Page 185: ...с 2 44 Пример огибающей квадратной формы Square Рис 2 45 Пример огибающей наклонной формы Slope 2 54 Шифр 10580 00231 Ред В Анализатор спектра РИ ООО Техэнком Контрольно измерительные приборы и оборудование www tehencom com ...

Page 186: ...оты Включите функцию Limit Mirror только после того как будет построена половина ограничительной линии После включения вторая половина ограничительной линии будет достроена автоматически Save Limit Нажатие данной клавиши подменю открывает диалоговое окно для сохранения текущей верхней и нижней ограничительных линий Пользователь может дать название ограничительной линии по своему усмотрению или при...

Page 187: ... Tee Открывает подменю Bias Tee сепаратор питания Bias Tee Включение выключение переменного питания Bias Tee Voltage Используйте данное подменю для установки напряжения питания Текущее напряжение сепаратора питания показано красным шрифтом рядом с верхом сетки Current Переключения тока между низким Low и высоким High Back Возврат в меню Options Back Возврат на предыдущий уровень меню Рис 2 47 Меню...

Page 188: ...ра 2 30 Другие меню Меню Preset File Mode и System описываются в Руководстве пользователя Анализатор спектра РИ Шифр 10580 00231 Ред В 2 57 ООО Техэнком Контрольно измерительные приборы и оборудование www tehencom com ...

Page 189: ...Анализатор спектра 2 58 Шифр 10580 00231 Ред В Анализатор спектра РИ ООО Техэнком Контрольно измерительные приборы и оборудование www tehencom com ...

Page 190: ...ре выбора режима анализатора интерференций настройки частоты полосы обзора амплитуды GPS ограничительных линий маркеров и управление файлами см в Руководстве пользователя 3 3 Режим Spectrum В режиме анализатора спектра прибор имеет возможность выполнения следующих измерений нажатием одной клавиши напряженность поля занимаемый диапазон частот мощность в канале мощность в соседнем канале и отношение...

Page 191: ... всей спектрограммы нажатием клавиши подменю Time Span 6 Чтобы изменить время между развертками нажмите клавишу подменю Sweep Interval и с помощью вращающейся ручки или клавиатуры установить время в диапазоне от 0 до 660 секунд Ввод временного интервала приводит к автоматическому вычислению соответствующего значения продолжительности Значение продолжительности можно просмотреть или изменить нажати...

Page 192: ...ker позволяет разместить на сигнале до 6 маркеров и отобразить мощность и частоту в месте установки каждого маркера Примечание Изображения на экране приводятся в качестве примеров Изображение и детали измерения на вашем приборе могут отличаться от примеров приведенных в данном Руководстве по измерению Рис 3 1 Спектрограмма в режиме анализатора интерференций Анализатор спектра РИ Шифр 10580 00231 Р...

Page 193: ...иенты Процедура Описываемая ниже процедура демонстрирует стандартную настройку анализатора интерференций для измерения мощности сигнала 1 Подключите подходящую направленную антенну к порту RF In и нажмите клавишу главного меню Measurements 2 Нажмите клавишу подменю Signal Strength на экране отобразится режим измерения мощности сигнала Нажмите клавишу подменю Signal Strength откроется меню Signal S...

Page 194: ...ечения указанной продолжительности измерение останавливается В зависимости от выбранного временного интервала данные будут прокручиваться влево после заполнения экрана траекторией 4 Нажмите клавишу Auto Scale для автоматической установки опорного уровня и коэффициента шкалы для размещения траектории на экране Примечание Time Span захватывает только последний экран а не всё время продолжительности ...

Page 195: ...деление или 5 дБ деление 3 Нажмите клавишу главного меню BW и установите Auto RBW или Auto VBW в положение On или установите применимые значения RBW и VBW посредством нажатия клавиш подменю RBW и VBW 4 Нажмите клавишу главного меню Measurements 5 Для активизации измерения нажмите клавишу подменю Signal ID Для просмотра меню Signal ID и настройки параметров измерения нажмите клавишу Signal ID ещё р...

Page 196: ... Однократная развертка и просмотр Рис 3 4 Идентификация сигнала в режиме анализатора интерференций тип сканирования All все Рис 3 5 Идентификация сигнала в режиме анализатора интерференций тип сканирования Freq частота Анализатор спектра РИ Шифр 10580 00231 Ред В 3 7 ООО Техэнком Контрольно измерительные приборы и оборудование www tehencom com ...

Page 197: ...меню режима анализатора сигналов и их соответствующие подменю Подменю перечисляются в порядке их появления на экране сверху вниз под каждым основным меню Только для Cell Site и Spectrum Master Подменю см на следующих двух рисунках Рис 3 6 Клавиши главного меню 3 8 Шифр 10580 00231 Ред В Анализатор спектра РИ ООО Техэнком Контрольно измерительные приборы и оборудование www tehencom com ...

Page 198: ...Анализатор интерференций Рис 3 7 Клавиши меню Measurements Измерения 1 из 2 Анализатор спектра РИ Шифр 10580 00231 Ред В 3 9 ООО Техэнком Контрольно измерительные приборы и оборудование www tehencom com ...

Page 199: ...нализатор интерференций Рис 3 8 Клавиши меню Measurements Измерения 2 из 2 3 10 Шифр 10580 00231 Ред В Анализатор спектра РИ ООО Техэнком Контрольно измерительные приборы и оборудование www tehencom com ...

Page 200: ...Анализатор интерференций Рис 3 9 Клавиши подменю Sweep Развертка Анализатор спектра РИ Шифр 10580 00231 Ред В 3 11 ООО Техэнком Контрольно измерительные приборы и оборудование www tehencom com ...

Page 201: ...ренций Рис 3 10 Клавиши подменю Trace Траектория Рис 3 11 Клавиши подменю Limit Ограничение 3 12 Шифр 10580 00231 Ред В Анализатор спектра РИ ООО Техэнком Контрольно измерительные приборы и оборудование www tehencom com ...

Page 202: ...Анализатор интерференций Рис 3 12 Подменю Options Опции меню System Анализатор спектра РИ Шифр 10580 00231 Ред В 3 13 ООО Техэнком Контрольно измерительные приборы и оборудование www tehencom com ...

Page 203: ...или вращающейся ручки необходимую начальную частоту Если введенное значение начальной частоты выше текущей конечной частоты конечная частота будет изменена таким образом чтобы получить полосу обзора в 10 Гц Stop Freq Нажатие клавиши главного меню Freq с последующим нажатием клавиши подменю Stop Freq позволяет ввести с помощью клавиатуры клавиш со стрелками или вращающейся ручки необходимую конечну...

Page 204: ...у или вращающуюся ручку Signal Standard Клавиши со стрелками Вверх Вниз или вращающаяся ручка позволяют выделить стандарт сигнала для подтверждения выбора нажмите Enter После выбора стандарта сигнала прибор выполняет автоматическую подстройку центральной частоты и полосы обзора для первого канала последнего сегмента конкретного стандарта Также автоматически выполняются и другие настройки разнос ча...

Page 205: ...иша дает возможность быстро уменьшить полосу обзора Первое нажатие этой клавиши подменю приводит к уменьшению полосы обзора до ближайшего целого числа начинающегося с 1 2 или 5 Например если полоса обзора установлена на 1 8 МГц нажатие этой клавиши подменю в первый раз установит значение полосы обзора на 1 0 МГц следующее нажатие на 500 кГц затем на 200 кГц и т д Full Span Нажатие данной клавиши у...

Page 206: ... уровней Atten Lvl Данная клавиша подменю позволяет изменить значение ослабления при помощи клавиатуры вращающейся кнопки или клавиш со стрелками RL Offset On Off Данная клавиша позволяет компенсировать наличие внешнего входного ослабления или усиления Для компенсации внешнего усилителя введите положительное значение для компенсации внешнего аттенюатора введите отрицательное значение Клавиша позво...

Page 207: ...лько шум будут как правило показывать меньшую амплитуду по сравнению с теми которые содержат дискретные сигнала Quasi peak При выборе данного метода становятся доступными полосы пропускания и полосы видеосигнала 200 Гц 9 кГц и 120 кГц Данный метод детектирования разработан в соответствии с требованиями Международного комитета по борьбе с радиопомехами CISPR Sample Данный метод является самым быстр...

Page 208: ...опускания к полосе видеосигнала можно установить с помощью клавиши подменю RBW VBW RBW VBW Данная клавиша подменю отображает соотношение между полосой пропускания и полосой видеосигнала Для изменения этого соотношения нажмите эту клавишу подменю и с помощью клавиатуры клавиш со стрелками или вращающейся ручки выберите новое соотношение По умолчанию соотношение устанавливается на 3 В случае выбора ...

Page 209: ...ectrogram Спектрограмма на стр 3 28 Signal Strength Нажатие клавиши Signal Strength переводит прибор в режим отображения мощности сигнала Когда режим Signal Strength активный нажатие клавиши подменю Signal Strength открывает меню Signal Strength См Меню Signal Strength Мощность сигнала на стр 3 29 RSSI Нажатие клавиши RSSI переводит прибор в режим отображения мощности принятого сигнала RSSI Когда ...

Page 210: ... 3 23 ACPR Вход в меню измерения соотношения мощность в соседнем канале См Меню ACPR Мощность в соседнем канале на стр 3 24 AM FM Demod Пользователь может выбрать демодуляцию АМ узкополосной ЧМ компенсация предыскажений 300 мкс широкополосной ЧМ компенсация предыскажений 50 мкс и верхней боковой полосы или нижней боковой полосы См Меню AM FM Demod АМ ЧМ Демодуляция на стр 3 25 C I Измерение отноше...

Page 211: ... Спектр на стр 3 21 Рис 3 21 Меню Field Strength в режиме анализатора интерференций Меню OCC BW Занимаемый диапазон частот Последовательность клавиш Measurements Spectrum OCC BW On Off Включение выключение функции измерения занимаемого диапазона частот Method Выбор режима измерения от мощности по умолчанию или dBc выбор отображается в области для сообщений С помощью клавиатуры клавиш со стрелками ...

Page 212: ... со стрелками Вверх Вниз изменяют частоту на величину шага частоты введенную в меню Freq Клавиши со стрелками Влево Вправо изменяют частоту на 10 от величины полосы обзора Ch Pwr Width Устанавливает ширину для мощности в канале Для ввода ширины мощности в канале воспользуйтесь клавиатурой клавишами со стрелками или вращающейся ручкой Клавиши со стрелками Вверх Вниз изменяют установленное значение ...

Page 213: ... GHz MHz kHz или Hz для принятия введенного значения частоты Ch Spacing Устанавливает величину разноса частоты между основным и соседним каналами Для ввода конкретной частоты воспользуйтесь клавиатурой клавишами со стрелками или вращающейся ручкой При вводе значения с клавиатуры используйте клавиши подменю GHz MHz kHz или Hz для принятия введенного значения частоты Данное значение должно быть боль...

Page 214: ...демодуляции для подтверждение выбора нажмите клавишу Enter Время демодуляции можно установить в диапазоне от 100 миллисекунд дл 200 секунд Прибор выполняет одну развертку за каждый период демодуляции Развертка делает паузу в течение периода демодуляции Set Demod Freq to Current Marker Freq Устанавливает частоту демодуляции на частоту текущего маркера Beat Freq Osc Устанавливает частоту биений гете...

Page 215: ...кополосный сигнал с изменяемой несущей Используйте данную настройку для измерения сигнала 802 11b WB FHSS Широкополосный сигнал с изменяемой несущей Используйте данную настройку для измерения сигнала 802 11а или 802 11g Broadband Используйте данную настройку для измерения сигнала в цифровом формате модуляции например CDMA и GSM Back Возврат в меню C I Min Sweep Time Устанавливает минимальное время...

Page 216: ... выборе режима Channel значение опорной мощности является объединением отдельных пиков в рамках канала Channel Width Ширина канала Channel Width устанавливается в пределах стандарта сигнала Signal Standard Данная клавиша позволяет регулировать ширину канала так как это необходимо Peak Marker On Off Включение данной функции отображает маркер пика в пределах сегмента спектральной маски Например если...

Page 217: ... отображению при нажатии клавиши подменю Sweep Interval Record On Off Когда Time Span установлено на значение отличное от Auto нажатие клавиши подменю Record позволяет автоматически сохранять графики спектрограммы в случае заполнения каскадного экрана Time Cursor Временной курсор используется для просмотра спектра в любой точке спектрограммы Горизонтальный временной курсор включается нажатием клав...

Page 218: ...ния и измерять напряженность поля в частотном диапазоне антенны в следующих единицах дБм метр дбВ метр дБмВ метр дБмкВ метр вольт метр или ватт метр On Off Включение выключение измерения напряженности поля Antenna Нажатие данной клавиши подменю вызывает диалоговое окно со списком всех антенн данные которых имеются в приборе включая как стандартные антенны так и пользовательские которые были добавл...

Page 219: ...томатическая установка опорного уровня и коэффициента шкалы для размещения траектории на экране Record On Off Чтобы сохранить данные RSSI нажмите клавишу подменю Record On Off чтобы включить архивирование данных Каждый полный экран состоящий из 551 точки данных будет сохранен как отдельный экран прибор позволяет сохранить данные до 7 дней Прибор сохраняет данные в папку с сохраненными траекториями...

Page 220: ...nitoring Включение непрерывной развертки для указанных начальной и конечной частот частотного диапазона или частоты сканирования Single Sweep and Review Переключение функции Signal ID в режиме однократной развертки и выполнение однократной развертки для просмотра Для выполнения последующих отдельных разверток необходимо нажать клавишу подменю Trigger Sweep Trigger Sweep Запуск однократной развертк...

Page 221: ...Нажатие данной клавиши устанавливает активный в данный момент маркер на самую высокую точку амплитуды сигнала отображаемого на экране Marker Freq to Center Перемещает частоту отмеченную активным маркером в положение центральной частоты и в центр экрана Marker to ref Level Нажатие данной клавиши устанавливает амплитуду активного в данный момент маркера в качестве опорного уровня который отображаетс...

Page 222: ...маркера по направлению к более высоким частотам Если прибор не обнаружит пик удовлетворяющий данному требованию то маркер устанавливается в правый конец траектории Клавиша Peak Threshold позволяет указать параметры поиска пиков Delta Marker to Span Устанавливает общую ширину полосы обзора на значение дельта маркера Если дельта маркер установлен на ноль то полоса обзора устанавливается на 10 Гц Есл...

Page 223: ...ом пользователь может выбрать канал Выберите номер канала для текущего стандарта сигнала и активный маркер будет установлен на центральную частоту данного канала Если стандарт сигнала не был выбран то на экране прибора появится сообщение No standard selected Press Enter or Escape to Continue Стандарт сигнал не выбран Нажмите Enter или Escape для продолжения работы Нажатие любой из указанных клавиш...

Page 224: ... конкретных измерительных задач В общем случае количество точек измерения по ширине экрана превышает количество точек отображения Различные методы детектирования это различные способы выбора точки измерения которая будет отображаться в каждой точке отображения См Меню Detection Детектирование на стр 3 18 Min Sweep Time Данная функция позволяет установить минимальное время развертки Время развертки...

Page 225: ...осе обзора Zero Span Change Trigger Position Данная клавиша подменю используется вместе с режимом видео запуска для настройки горизонтального положения на экране где будет располагаться сигнал отвечающий критерию режима видео запуска Значение можно установить в диапазоне от 0 до 100 Значение 0 помещает событие при котором происходит запуск в левый край экрана а значение 100 в правый Когда положени...

Page 226: ...авливает начало ждущей развертки отмеченное левой синей линией на нижнем графике Gate Length Устанавливает время ждущей развертки отмеченное правой синей линией на нижнем графике Zero Span Time Данная клавиша подменю позволяет установить время полной горизонтальной развертки на графике во временной области нижний Back Возврат в Меню Sweep Развертка на стр 3 35 Рис 3 37 Меню Gated Sweep в режиме ан...

Page 227: ...ивно только при измерениях в режиме Spectrum Оно не работает в режимах измерения Spectrogram Signal Strength RSSI или Signal ID Нажатие клавиши Measure открывает Меню Spectrum Спектр на стр 3 21 3 38 Шифр 10580 00231 Ред В Анализатор спектра РИ ООО Техэнком Контрольно измерительные приборы и оборудование www tehencom com ...

Page 228: ...тивную траекторию Write Hold Позволяет выбрать или удерживание текущей траектории развертки на экране или постоянное выполнение развертки и обновление отображаемых результатов измерения Эта функция применима к Траектории В или Траектории С только при условии активного состояния математических операций с участием Траектории А Trace A Operations Вызов меню Trace A Ops для выбора операций применимых ...

Page 229: ...ой точки отображения за несколько разверток траектории Average A Отображение экспоненциального среднего числа траекторий определенных с помощью клавиши of Averages of Averages Установка числа траекторий для вычисления среднего отображаемого значения Число результатов для усреднения может устанавливаться в диапазоне от 1 до 65535 Back Возврат в Меню Trace Траектория на стр 3 39 Рис 3 39 Меню Trace ...

Page 230: ...Траектории С и наоборот Max Hold В Отображение накопленного максимального значения каждой точки отображения за несколько разверток траектории Min Hold В Отображение накопленного минимального значения каждой точки отображения за несколько разверток траектории Back Возврат в Меню Trace Траектория на стр 3 39 Рис 3 40 Меню Trace В Ops в режиме анализатора интерференций Анализатор спектра РИ Шифр 1058...

Page 231: ...ажение Траекторий А и В Relative Ref Устанавливает значение применяемое к верхней сетке для относительной шкалы которая появляется справа от графика при активизированной функции математических операций над траекториями Данное значение можно изменить с помощью вращающейся ручки клавиш со стрелками Вверх Вниз или ввода значения с помощью приборной клавиатуры и нажатия клавиши подменю dB или клавиши ...

Page 232: ...ная в данный момент отмечается на экране красным кружком Limit Move Отображение Меню Limit Move Перемещение ограничения на стр 3 46 Limit Envelope Ограничительная огибающая линия очень удобная для обнаружения новых сигналов при наличии других ранее присутствовавших сигналов Функция Limit Envelope позволяет автоматически создавать верхние или нижние ограничительные линии на основе отображаемых на э...

Page 233: ...плитуда является той же что и текущая единица вертикальной амплитуды Более подробно см в разделе Подменю Add Point Клавиши со стрелками Вверх Вниз позволяют переместить амплитуду на 5 от высоты экрана Add Point Нажатие данной клавиши подменю позволяет добавить точку перегиба ограничительной линии Конкретное поведение данной клавиши подменю зависит от того какая точка перегиба активна в момент нажа...

Page 234: ... подменю удаляет активную в данный момент точку Активной становится точка расположенная слева от удаленной точки Next Point Left Нажатие данной клавиши подменю позволяет выбрать точку перегиба находящуюся слева от активной точки и сделать её активной для редактирования или удаления Каждое нажатие клавиши Next Point Left делает активной точку находящуюся слева от ранее активной точки до тех пор пок...

Page 235: ...Вверх Вниз перемещают ограничительную линию на 5 от высоты экрана Клавиши Влево Вправо перемещают ограничительную линию на 0 2 от высоты экрана или на 0 2 дБ когда шкала установлена на 10 дБ деление Move Limit Hz Нажатие данной клавиши подменю позволяет изменять частоту ограничительной линии Все точки перегиба смещаются на введенное значение Изменение значения также можно выполнять и с помощью вра...

Page 236: ...и выбрано верхнее ограничение Upper Limit Lower Offset Нижнее смещение если выбрано нижнее ограничение Lower Limit Данная клавиша подменю используется для определения расстояния на котором будут размещены верхняя и нижняя огибающая от измеренного сигнала Диапазон 100 дБ Для верхней огибающей значение как правило будет положительным если необходимо разместить огибающую над сигналом Для нижней огиба...

Page 237: ... Рис 3 47 Пример огибающей квадратной формы Square Рис 3 48 Пример огибающей наклонной формы Slope 3 48 Шифр 10580 00231 Ред В Анализатор спектра РИ ООО Техэнком Контрольно измерительные приборы и оборудование www tehencom com ...

Page 238: ...лючите функцию Limit Mirror только после того как будет построена половина ограничительной линии После включения вторая половина ограничительной линии будет достроена автоматически Save Limit Нажатие данной клавиши подменю открывает диалоговое окно для сохранения текущей верхней и нижней ограничительных линий Пользователь может дать название ограничительной линии по своему усмотрению или принять н...

Page 239: ... Tee Открывает подменю Bias Tee сепаратор питания Bias Tee Включение выключение переменного питания Bias Tee Voltage Используйте данное подменю для установки напряжения питания Текущее напряжение сепаратора питания показано красным шрифтом рядом с верхом сетки Current Переключения тока между низким Low и высоким High Back Возврат в меню Options Back Возврат на предыдущий уровень меню Рис 3 50 Меню...

Page 240: ...енций 3 19 Другие меню Меню Preset File Mode и System описываются в Руководстве пользователя Анализатор спектра РИ Шифр 10580 00231 Ред В 3 51 ООО Техэнком Контрольно измерительные приборы и оборудование www tehencom com ...

Page 241: ...ООО Техэнком Контрольно измерительные приборы и оборудование www tehencom com ...

Page 242: ...ветствующие частотные настройки Параметры частоты и полосы пропускания можно ввести вручную выбрав Scan Frequencies если ни один из доступных стандартов радиоинтерфейса не соответствует требованиям решаемой задачи Пользователь также может создать собственный список из 20 независимых каналов С помощью пакета Master Software Tools программа Script Master позволяет расширить тестовые возможности скан...

Page 243: ...ale так чтобы мощность всех каналов отображалась бы на экране 4 Нажмите клавишу главного меню Measurements для активизации меню Measurement 5 Нажмите клавишу подменю Display и выберите Graph для отображения результатов измерения в графическом формате 6 Нажмите клавишу подменю Channel Units и выберите Channel для отображения результатов измерений в формате канала 7 Нажмите клавишу подменю Units Dis...

Page 244: ...dwidth установка полосы пропускания и с помощью вращающейся ручки или клавиатуры введите требуемое значение в Гц кГц МГц или ГГц 7 Нажмите клавишу подменю Done Editing 8 Повторите шаги с 3 по 7 для редактирования дополнительных каналов 4 5 Пример пользовательской настройки Данный пример показывает как можно отслеживать несколько сигналов а также результат возможной интермодуляции с целью определен...

Page 245: ...аналов в Script Master Test File также могут тестироваться по отдельности Для установки этого параметра воспользуйтесь клавишей подменю of Repeats Set Например установка этого параметра на 5 означает что каждая группа из 20 каналов будет протестирована 5 раз перед тем как прибор перейдёт к тестированию следующей группы каналов Функция of Repeats Set количество повторений группа может использоватьс...

Page 246: ...n для установки необходимой продолжительности сканирования Величина времени на клавише подменю отображается красным цветом что означает что значение можно отредактировать Нажатие какой либо цифры на клавиатуре вызывает меню Time Завершите ввод соответствующей единицей времени 5 Если необходимо повторение тестирования внутри группы нажмите клавишу подменю of Repeats Sets и введите требуемое число ц...

Page 247: ...лы описывают главные меню режима сканера каналов и их соответствующие подменю Подменю перечисляются в порядке их появления на экране сверху вниз под каждым основным меню Рис 4 1 Клавиши главного меню 4 6 Шифр 10580 00231 Ред В Анализатор спектра РИ ООО Техэнком Контрольно измерительные приборы и оборудование www tehencom com ...

Page 248: ...авиши подменю позволяют импортировать новый файл или изменить параметры установленные в файле Script Master созданном в программе Master Software Tools Рис 4 2 Меню Scanner в режиме сканера каналов Меню Channel Scan Сканируемые каналы Последовательность клавиш Scanner Scan Channels Signal Standard Открывает диалоговое окно со списком стандартов сигналов Signal Standard для выбора требуемого станда...

Page 249: ...ния между частотами на экране Bandwidth Полоса пропускания канала может быть установлена вручную в ГГц МГц кГц или Гц Number of Channels Установка числа отображаемых каналов от 1 до 20 Back Возврат в Меню Scanner Сканер на стр 4 7 Рис 4 4 Меню Freq Scan в режиме сканера каналов 4 8 Шифр 10580 00231 Ред В Анализатор спектра РИ ООО Техэнком Контрольно измерительные приборы и оборудование www tehenco...

Page 250: ...пы of Repeats Set Scan Duration Устанавливает время сканирования каналов для использования с Repeat Scan Type of Repeats Set Устанавливает число повторений сканирования для каждой группы из 20 каналов Record On Off Включает режим записи Когда прибор выполнит указанное число сканирований Scans или истечет установленное время Time результаты измерения будут сохранены в память прибора Start Restart T...

Page 251: ...итуду на верхний край экрана Доступные значения в диапазоне от 30 дБ до 130 дБм Scale Активизирует функцию шкалы устанавливая значение дБ деление в диапазоне от 1 дБ деление до 15 дБ деление с шагом 1 дБ Рис 4 6 Меню Amplitude в режиме сканера каналов 4 10 Шифр 10580 00231 Ред В Анализатор спектра РИ ООО Техэнком Контрольно измерительные приборы и оборудование www tehencom com ...

Page 252: ...dard канал Channel частоту Frequency и полосу пропускания Bandwidth для выбранной позиции Number of Channels Устанавливает число отображаемых каналов от 1 до 20 Back Возврат в предыдущее меню Рис 4 7 Меню Custom Scan в режиме сканера каналов Анализатор спектра РИ Шифр 10580 00231 Ред В 4 11 ООО Техэнком Контрольно измерительные приборы и оборудование www tehencom com ...

Page 253: ...ниц отображения информации о канале между номером канала и частотой Units Display Current Max Текущие единицы мощности отображаются внизу каналов или отображается максимальная мощность может быть включена только когда Max Hold установлено на On или 5 sec Color Code Single Dual Каналы могут быть представлены в одном или двух чередующихся цветах Рис 4 8 Меню Measurements в режиме сканера каналов При...

Page 254: ...е результатов измерения в графическом режиме Рис 4 10 Отображение результатов измерения в табличном режиме Анализатор спектра РИ Шифр 10580 00231 Ред В 4 13 ООО Техэнком Контрольно измерительные приборы и оборудование www tehencom com ...

Page 255: ... 4 14 Меню Trace Траектория Данное меню не доступно в режиме Сканера каналов 4 15 Меню Limit Ограничение Данное меню не доступно в режиме Сканера каналов 4 16 Другие меню Описание меню Preset File Mode и System см в Руководстве пользователя 4 14 Шифр 10580 00231 Ред В Анализатор спектра РИ ООО Техэнком Контрольно измерительные приборы и оборудование www tehencom com ...

Page 256: ...р пока приемник не потеряет сигнал Внешний делитель подает сигнал на ВЧ вход RF In прибора На экране прибора отображается мощность и частота на входе Амплитуда устанавливается с помощью внешнего ступенчатого аттенюатора Внешний делитель и аттенюатор поставляются по отдельному заказу как Комплект генератора непрерывных сигналов шифр 69793 Фиксированные уровни непрерывного сигнала изменяются как фун...

Page 257: ... CW Signal Generator 2 Подключите аттенюатор к порту RF Out а делитель к порту RF In как показано на Рис 5 1 Рис 5 1 Подключение для работы в режиме генератора непрерывных сигналов 5 2 Шифр 10580 00231 Ред В Анализатор спектра РИ ООО Техэнком Контрольно измерительные приборы и оборудование www tehencom com ...

Page 258: ...жмите клавишу меню Freq и установите требуемую частоту Рис 5 2 Меню Frequency в режиме генератора непрерывных сигналов Анализатор спектра РИ Шифр 10580 00231 Ред В 5 3 ООО Техэнком Контрольно измерительные приборы и оборудование www tehencom com ...

Page 259: ...5 Измените настройки на аттенюаторе чтобы подстроить уровень мощности Большая кнопка изменяет мощность с шагом 10 дБ а маленькая кнопка подстраивает уровень мощности с шагом в 1 дБ 6 Нажмите клавишу подменю Offset и установите смещение в дБ для уровня амплитуды Данное смещение будет компенсировать какое либо ослабление которое будет иметь место в линии на участке между делителем и тестируемым устр...

Page 260: ...ителя Unable to add additional limit points d is the maximum Невозможно добавить дополнительные ограничительные точки d является максимальным значением Hidden inflection points prevent this action Decrease Span to reveal hidden points Невозможно выполнить это действие из за скрытых точек перегиба Увеличьте полосу обзора Span для отображения скрытых точек Trace A has no data to view Траектория А не...

Page 261: ...возможна в этом режиме Marker must be ON to Use the feature Маркер необходимо включить чтобы использовать эту функцию Triggering valid only in Zero Span Запуск возможен только в нулевой полосе обзора Zero Span Only HOLD is valid for Trace B Только HOLD действительно для Траектории В Cannot change average for Recalled Inactive Traces Невозможно изменить среднее для вызванных неактивных траекторий C...

Page 262: ... меню Custom Scan 4 11 меню Detection анализатор интерференций 3 18 анализатор спектра 2 29 меню Field Strength анализатор интерференций 3 22 анализатор спектра 2 39 меню Freq анализатор интерференций 3 14 анализатор спектра 2 26 меню Freq Scan 4 8 меню Gated Sweep анализатор интерференций 3 37 анализатор спектра 2 37 меню Limit анализатор интерференций 3 43 анализатор спектра 2 49 меню Limit Adva...

Page 263: ...П параметры полосы пропускания анализатор спектра 2 2 параметры развертки 2 3 полоса видеосигнала 2 5 полоса пропускания RBW 2 5 предусилитель настройки 2 6 С символы безопасности 1 сканер каналов Script Master 4 4 введение 4 1 пользовательская настройка 4 3 пример измерения 4 2 сканер каналов меню 4 6 скорость развертки 2 6 спектральная маска излучаемого сигнала 2 44 3 27 спектрограмма 3 2 Указат...

Page 264: ...ООО Техэнком Контрольно измерительные приборы и оборудование www tehencom com ...

Page 265: ...ООО Техэнком Контрольно измерительные приборы и оборудование www tehencom com ...

Page 266: ...ut Option 89 Gated Sweep Option 90 Coverage Mapping Option 431 Electromagnetic Field EMF Option 444 AM FM PM Analyzer Option 509 Note Not all instrument models offer every option or every measurement within a given option Refer to the Technical Data Sheet of your instrument for available options and supported measurements Anritsu Company 490 Jarvis Drive Morgan Hill CA 95037 2809 USA http www anri...

Page 267: ...d copied or used in whole or in part as the basis for manufacture or sale of the equipment or software programs without the prior written consent of Anritsu Company Updates Updates if any can be downloaded from the Anritsu website at http www anritsu com For the latest service and sales contact information in your area please visit http www anritsu com contact us Product Information Compliance and...

Page 268: ... Functions 2 9 2 8 Detection 2 10 2 9 Indications of Excessive Signal Level 2 10 2 10 Preamplifier Measurement Example 2 14 2 11 Field Measurements 2 14 2 12 Field Strength 2 15 Antenna Calculations 2 15 2 13 Occupied Bandwidth Measurement 2 16 2 14 Channel Power Measurement 2 18 Channel Power Measurement for GSM 2 18 2 15 Adjacent Channel Power Measurement 2 20 2 16 EMF Measurement Option 444 2 2...

Page 269: ... 42 Measure Menu 3 of 5 2 43 Measure Menu 4 of 5 2 44 Measure Menu 5 of 5 2 45 Sweep Menu 2 46 Trace Menus 2 47 Limit Menus 2 47 Application Options Menu 2 48 2 26 Freq Frequency Menu 2 49 Freq Frequency Menu Continued 2 50 2 27 Frequency Menu Freq 1 2 with Offset Function 2 51 Freq 2 2 Menu 2 53 2 28 Amplitude Menu 2 55 Units Detection Menu 2 56 2 29 Span Menu 2 57 2 30 Zero Span IF BW Menu Optio...

Page 270: ... 24 2 86 IQ Capture Triggering Menu 2 87 IQ Capture Save Menu 2 87 IQ Capture Frequency Amplitude Menu 2 88 Coverage Mapping Menu Option 431 2 89 2 35 Trace Menu 2 90 Trace A Ops Menu 2 92 Trace B Ops Menu 2 93 Trace C Ops Menu 2 94 2 36 Limit Menu 2 95 Edit Menu Limit 2 96 Edit Menu Continued 2 97 Limit Move Menu 2 98 Limit Envelope Menu 2 99 Limit Advanced Menu 2 101 2 37 Application Options Men...

Page 271: ...3 Measurements Menu 2 of 4 3 24 Measurements Menu 3 of 4 3 25 Measurements Menu 4 of 4 3 26 Marker Menus 3 27 Sweep Menus 3 28 Trace Menus 3 29 Limit Menus 3 29 Application Options Menu 3 30 3 10 Freq Frequency Menu 3 31 Freq Frequency Menu Continued 3 32 3 11 Frequency Menu with Offset Function 3 33 Freq 2 2 Menu 3 34 Span Menu 3 36 3 12 Zero Span IF BW Menu Option 89 3 37 3 13 Amplitude Menu 3 3...

Page 272: ...veform Capture Menu Option 24 3 58 IQ Capture Triggering Menu 3 59 IQ Capture Save Menu 3 59 IQ Capture Frequency Amplitude Menu 3 60 Coverage Mapping Menu Option 431 3 61 Spectrogram Menu 3 62 Signal Strength Menu 3 63 RSSI Menu 3 64 Signal ID Menu 3 65 Interference Mapping Menu 3 66 Bearing Lines Menu 3 67 Mapping Save Recall Menu 3 68 Direction Finding Menu 3 69 Pan Zoom Menu 3 70 DF Sound Sett...

Page 273: ...surement Setups 4 1 4 3 Sample Procedure 4 2 4 4 Custom Setup Measurements 4 3 4 5 Custom Setup Example 4 3 4 6 Script Master Measurement Setup 4 4 4 7 Channel Scanner Menu Map 4 6 4 8 Scanner Menu 4 7 Channel Scan Menu 4 7 Freq Scan Menu 4 8 Scan Script Master Menu 4 9 4 9 Amplitude Menu 4 10 4 10 Custom Scan Menu 4 11 4 11 Measurements Menu 4 12 4 12 Sweep Menu 4 14 4 13 Measure Menu 4 14 4 14 T...

Page 274: ...istance Time Setup Menu 6 20 RSSI Menu 6 21 ACPR Menu 6 22 Chapter 7 AM FM PM Analyzer Option 509 7 1 Introduction 7 1 7 2 General Measurement Setup 7 2 7 3 Example FM Demodulation Measurement 7 4 7 4 AM FM PM Analyzer Menus 7 8 Map of Main Menus 7 8 Map of Frequency Menus 7 9 Map of Measurements Menus 7 10 Map of Audio Demod Menus 7 11 7 5 RF Freq Frequency Menu 7 12 7 6 RF Span Menu 7 13 7 7 Sig...

Page 275: ...etup Menu 7 27 Point Distance Time Setup Menu 7 28 7 19 Audio Demod AM Menu 7 29 7 20 Audio Demod FM Menu 7 30 7 21 Marker Menu 7 31 Chapter 8 Bias Tee Option 10 8 1 Introduction 8 1 8 2 Bias Tee Menu 8 3 Chapter 9 EMF Option 444 9 1 Introduction 9 1 9 2 Connecting the Antenna 9 1 9 3 EMF Menu 9 2 EMF Auto Menu 9 3 Trace Menu 9 4 9 4 Measurement Results 9 5 Pass Fail 9 6 Index ООО Техэнком Контрол...

Page 276: ... as examples Illustrations of menu maps or menu trees may show submenu keys that display only under certain conditions The actual displays screen menus and measurement details may differ based on instrument model firmware version installed options and current instrument settings 1 2 Selecting a Measurement Mode To switch to another measurement mode or application 1 Press the Shift front panel key ...

Page 277: ...can find links to sales service and support contact information for your country or region You can also provide online feedback complete a Talk to Anritsu form to have your questions answered or obtain other services offered by Anritsu Updated product information can be found on the Anritsu website http www anritsu com Search for the product model number The latest documentation is on the product ...

Page 278: ...file management 2 3 Making Spectrum Analyzer Measurements Required Equipment Optionally an antenna that is appropriate for the frequency range to be measured Required Setup Place the instrument in Spectrum Analyzer mode Refer to Selecting a Measurement Mode on page 1 1 Connect the input signal or antenna to the RF In test port Setting Frequency The tuning frequency range can be entered in several ...

Page 279: ...d Off the label and value turn red and a symbol is shown in front of the RBW label Adjust resolution bandwidth independently of the span If an unavailable resolution bandwidth is entered then the instrument selects the next higher resolution bandwidth If a value greater than the widest RBW is entered then the widest RBW will be selected VBW can be set two ways manually or by auto coupling Auto cou...

Page 280: ...erformance No FFT or Burst Detect Note that Burst Detect is supported on MS2720T and MT8220T instrument models only Improperly installed cellular boosters can sometimes produce burst interference By using Burst Detect mode when available a narrow pulsed or burst signal is easily seen in spectrum analyzer mode capturing emitters as narrow as 200 μs Burst Detect works in a maximum span of 15 MHz Fig...

Page 281: ...MS2720T model only This mode is used in zero span to set IF power level as the trigger source The power level can be set from 130 dBm to 30 dBm using the rotary knob arrow keys or keypad The trigger is based on the measured signal level If no signal reaches or exceeds the trigger level then no trace will be displayed on the screen Zero Span IF Output Standard or Option 89 Zero Span IF Output provi...

Page 282: ...the Zero Span submenu key a second time displays the Zero Span IF Bandwidth menu Figure 2 2 The selectable bandwidth values may differ among instrument types This figure is typical The Normal IF BW choice selects a bandwidth that uses analog bandpass filters in the normal RBW chain By changing the RBW different filter bandwidths are selected The spectrum analyzer has several mixer bands Depending ...

Page 283: ...e the residual offset you need a second spectrum analyzer or a frequency counter 1 Attach a signal source or antenna to the spectrum analyzer and set the center frequency to the center of the signal being received 2 Press BW then Zero Span and then press Zero Span a second time to turn on the IF output 3 Attach a second spectrum analyzer to the IF output and set the center frequency to 140 MHz Set...

Page 284: ...the trigger source from which the gate is controlled Not all instrument models and options support all triggering selections Refer to Gate Setup Menu on page 2 67 Gate Polarity controls the triggering edge of the selected triggering source The Gate View Settings key brings up a submenu where you can independently set the Zero Span RBW Zero Span VBW and Zero Span Time Zero Span Time controls the ti...

Page 285: ...is it exists at a broad range of frequencies If the noise is included in the measurement the measured value could be in error too large depending upon the noise level With a wide bandwidth more noise is included in the measurement With a narrow bandwidth less noise enters the resolution bandwidth filter and the measurement is more accurate If the resolution bandwidth is narrower the noise floor wi...

Page 286: ...rrow RBW or VBW The sweep speed can also be changed manually by pressing the Sweep key and selecting the Sweep Time submenu key Enter a sweep time from 10 μs to 600 seconds If the minimum sweep time entered by the user is less than the value needed to assure accurate results the value that delivers accurate results will be used Regardless of the minimum sweep time setting the instrument will never...

Page 287: ... the signal amplitude drops briefly The method is also useful when looking at modulated signals to see if some frequencies are not being used Sample This is the fastest detection method because for each display point only one frequency point is measured Use this method when speed is of paramount importance and the possibility of missing a narrow peak is not important Quasi peak When this selection...

Page 288: ...9 Indications of Excessive Signal Level Spectrum Analyzer MG PN 10580 00349 Rev H 2 11 Figure 2 4 Normal Trace Figure 2 5 Saturation Off Screen ООО Техэнком Контрольно измерительные приборы и оборудование www tehencom com ...

Page 289: ...Signal Level Spectrum Analyzer 2 12 PN 10580 00349 Rev H Spectrum Analyzer MG Figure 2 6 ADC Over Range On Screen Figure 2 7 Saturation and ADC Overload ООО Техэнком Контрольно измерительные приборы и оборудование www tehencom com ...

Page 290: ...9 Indications of Excessive Signal Level Spectrum Analyzer MG PN 10580 00349 Rev H 2 13 Figure 2 8 Over Power Error MT8220T and MS2720T 0709 only ООО Техэнком Контрольно измерительные приборы и оборудование www tehencom com ...

Page 291: ...ifier is turned on the noise floor drops significantly 2 11 Field Measurements In Spectrum Analyzer mode smart one button measurements are built in for field strength occupied bandwidth channel power adjacent channel power ratio emission mask and carrier to interference ratio C I tests In addition AM FM SSB demodulation is available to aid in the identification of interfering signals The following...

Page 292: ...of the span has to include a frequency within the antenna s specified range 6 Press the BW main menu key and verify that Auto RBW and Auto VBW are On 7 To change the units of measurement press the Amplitude main menu key then press the Units submenu key and press dBm m2 dBV m dBmV m dBµV m Volt m Watt m2 dBW m2 A m dBA m or Watt cm2 The instrument automatically adjusts the measurement by the anten...

Page 293: ...ransmitted power dBc Method The occupied frequency bandwidth is defined as the bandwidth between the upper and lower frequency points at which the signal level is a desired number of dB below the peak carrier level Required Equipment Test Port Extension Cable Anritsu part number 15NNF50 1 5C 30 dB 50 Watt bi directional DC 18 GHz N m N f Attenuator Anritsu 42N50A 30 required if the power level bei...

Page 294: ... Pwr or dBc by pressing the Method submenu key The selected method is underlined 8 Press the dBc or submenu keys to adjust the settings as needed Common values are 99 and 30 dBc 9 Press the On Off submenu key to start the measurement An information box will appear below the graph while occupied bandwidth measurement is on Figure 2 10 shows the occupied bandwidth results using the percent of power ...

Page 295: ...ultiple Access FDMA and Time Division Multiple Access TDMA Within each band are approximately one hundred available carrier frequencies on 200 kHz spacing FDMA and each carrier is broken up into time slots so as to support eight separate conversations TDMA GSM uses the Gaussian Minimum Shift Keying GMSK modulation method Required Equipment Test Port extension cable Anritsu 15NNF50 1 5C Procedure 1...

Page 296: ...channel span or set the channel span to a value appropriate for the particular application 11 Make the measurement by pressing the Measure 4 key the Power and Bandwidth submenu key and the Channel Power submenu key Then press On The measurement results are displayed in the message area Note Channel Power is a constant measurement After it is turned on it will remain on until it is turned off by pr...

Page 297: ...RBW and Auto VBW are On 6 There are two ways to set the measurement parameters If the signal standard and channel are known press the Freq main menu key and set the signal standard and press Channel submenu key for the signal to be measured then skip to Step 12 If the signal standard and channel are not known follow the procedure in Step 7 through Step 11 7 Press the Freq main menu key press the C...

Page 298: ...spectrum analyzer Technical Data Sheets Procedure 1 Press the Shift key then the Mode 9 key to open the Mode Selector dialog box Use the Up or Down arrow keys to highlight the Spectrum Analyzer measurement mode and press Enter 2 Press the Shift key followed by the Measure 4 key 3 To access EMF Measurement press the Power and Bandwidth submenu key then EMF Measurement Chapter 9 EMF Option 444 provi...

Page 299: ... key Set the span wide enough to include the primary channel bandwidth and upper and lower channel bandwidths 4 Press the Amplitude main menu key then press the Reference Level submenu key and set the reference level to 20 dBm 5 Press the Auto Atten submenu key and select On 6 Press the BW main menu key then use the RBW and VBW submenu keys to set the resolution bandwidth to 3 kHz and the video ba...

Page 300: ...ompare the value of the marker to the specified allowable level of out of band spurious emissions for the corresponding channel transmit frequency 10 Repeat Step 8 and Step 9 for the remaining spurs Use either Marker 1 again or choose another marker Figure 2 12 shows a simulated out of band spurious signal 3 MHz from the carrier using a delta marker Figure 2 12 Out of Band Spurious Emission Measur...

Page 301: ...tor connect the RF In port to the appropriate transmit test port 2 Press the Freq main menu key press the Center Freq submenu key and enter the center frequency 3 Press the Span main menu key Set the span wide enough to include the primary channel bandwidth and upper and lower channel bandwidths 4 Press the Amplitude main menu key and then press the Reference Level submenu key to set the reference...

Page 302: ...bmenu key 4 Press the Demod Freq submenu key and use the keypad or rotary knob to enter the center frequency of the signal to be demodulated For USB and LSB signals fine tune the signal by adjusting the Beat Freq Osc By default the BFO frequency is set to zero meaning that the re injected carrier is exactly at the demodulation frequency The Beat Freq Osc submenu key allows adjustment of the beat f...

Page 303: ...ss point being measured and press Enter 3 Press the Shift key followed by the Measure 4 key Then press the Masks and C I submenu key and then the C I submenu key 4 Press the Center Freq or Offset Center Freq submenu key and enter the desired frequency unless a Signal Standard and Channel have already been selected in the Frequency menu 5 If needed press the Span submenu key and set an appropriate ...

Page 304: ...es show the C I measurement steps ready to measure the carrier Figure 2 13 with the carrier measured Figure 2 14 and the measurement results Figure 2 15 Figure 2 13 C I Measurement Ready to Measure the Carrier Figure 2 14 C I Measurement Carrier Measured ООО Техэнком Контрольно измерительные приборы и оборудование www tehencom com ...

Page 305: ... to Interference Ratio Measurement Spectrum Analyzer 2 28 PN 10580 00349 Rev H Spectrum Analyzer MG Figure 2 15 C I Measurement Results ООО Техэнком Контрольно измерительные приборы и оборудование www tehencom com ...

Page 306: ...d then the Emission Mask In Band submenu key 3 Press the Ref Power Peak Channel submenu key to toggle between the two settings When Peak is selected the mask is moved up or down so that the mask value at the center frequency is the same as the peak value of the trace When Channel is selected the reference power value is the same as would be calculated by the Channel Power measurement over the defi...

Page 307: ...enu key to select On See Figure 2 17 3 Press the Freq main menu key followed by the Start Freq submenu key and enter a value for the beginning point of a segment 4 Press the Stop Freq submenu key and enter a value for the end point of the segment 5 Optionally you can adjust the RBW VBW reference level and reference level offset However you cannot change the sweep mode or any of the following ampli...

Page 308: ...desired pass fail limit amplitude for the first point of the segment 10 Press Segment Stop Amplitude and enter the desired pass fail limit amplitude for the last point of the segment 11 Press Save Current Settings to Selected Segment 12 Repeat Step 3 through Step 11 as necessary to create more segments 13 Press Save Mask and enter the mask name in the Filename entry field If needed select Spurious...

Page 309: ...sions submenu by pressing the Shift key followed by the Measure 4 key then pressing the Masks and C I submenu key followed by the Spurious Emissions Out of Band key 7 Press Segment Setup 8 Press Segment Start Amplitude and enter the desired amplitude for the first point of the segment 9 Press Segment Stop Amplitude and enter the desired amplitude for the last point of the segment 10 Press Save Cur...

Page 310: ...submenu key followed by the Spurious Emissions Out of Band key 8 Press Segment Setup 9 Press Segment Start Amplitude and enter the desired amplitude for the first point of the segment 10 Press Segment Stop Amplitude and enter the desired amplitude for the last point of the segment 11 Press Save Current Settings to Selected Segment 12 Repeat Step 4 through Step 11 as necessary to add more segments ...

Page 311: ... measurement sweep of the full spurious emission mask See Figure 2 19 Sweeping All Segments Continuously 1 Press the Auto Save submenu key and select Off On or Full Refer to Auto Save Modes 2 Press the Sweep submenu key and select Continuous to start the measurements 3 Press Sweep again to select Single and stop the measurements Sweeping an Individual Segment 1 Press the Sweep submenu key and sele...

Page 312: ...ull The On setting saves an HTML file that will contain a table for each segment measured A status block in the table displays Pass or Fail for the individual segment The Overall Status at the end of the file indicates whether the spurious emission mask passed or failed See Figure 2 20 Figure 2 20 Spurious Emission Mask Segment Data Auto Save On ООО Техэнком Контрольно измерительные приборы и обор...

Page 313: ...o saved as a separate JPG file which is listed at the bottom of the segment table and labeled Screen Shot See Figure 2 21 2 23 Coverage Mapping Option 431 To initiate Coverage Mapping press the Shift key followed by the Measure 4 key then press the Coverage Mapping submenu key For a description of Coverage Mapping refer to Chapter 6 Coverage Mapping Option 431 Figure 2 21 Spurious Emission Mask Se...

Page 314: ...orm Capture menu 3 Press the Capture Length submenu key to set the length of time that data is taken 4 Press the Capture Mode submenu key and select either Single or Continuous Selecting Single will perform 1 capture when Start Capture is pressed When Continuous is selected multiple waveform captures that are the time length set in Capture Length are taken until the Start Capture button is pressed...

Page 315: ...lected waveform capturing ends when the Stop Capture initial state Start Capture button is pressed When Stop Capture is pressed the current capture cycle will be completed and then IQ capture will end The captured waveform is named and stored in the file location set by File Name Prefix and Capture Location Note When setting the Span set it slightly larger than the captured bandwidth This allows y...

Page 316: ...1 930 611 500 GHz Stop Freq 1 931 666 500 GHz Channel Signal Standard A Span Step Size Offset A Back Span Span 1 000 MHz Span Up 1 2 5 Span Down 1 2 5 Full Span Zero Span Last Span BW RBW 3 MHz VBW 1 MHz RBW VBW 3 Span RBW 100 Auto RBW On Off Auto VBW On Off VBW Average Type Linear Log Zero Span RBW 3 MHz Zero Span VBW 1 MHz Freq 1 2 Offset Center Freq 1 951 250 GHz Offset Start Freq 1 950 611 500...

Page 317: ...ore Peak Options More Delta On Off Back Marker 2 2 Marker Noise On Off Counter Marker On Off Marker Style Fixed Tracking Marker 1 Reference On Off All Markers Off Set Marker to Channel Market Table On Large Off Marker Peak Back Next Peak Left Next Peak Right Delta Marker to Span Marker Freq to Center Marker to Ref Lvl Peak Threshold 10 00 Peak Search ООО Техэнком Контрольно измерительные приборы и...

Page 318: ... Bandwidth Masks and C I AM FM Demod Generator On Off Coverage Mapping Save Recall Points Map Pan Zoom Power and BW Field Strength EMF Measurement Back Emission Mask In Band Spurious Emissions Out of Band ACPR Channel Power OCC BW IQ Waveform Capture Coverage Mapping IQ Waveform Capture Capture Length 10 ms Capture Mode Single Continuous Sample Rate 40 000 MHz Back Start Capture Triggering File Na...

Page 319: ...ated Measurements Units Limits ICNIRP Limit On Off Trace Back Refer to Chapter 9 Option 444 Power and BW Field Strength EMF Measurement Back ACPR Channel Power OCC BW Back ACPR Limits On Off Ch Pwr Limit 10 0 dBm Ch Pwr Limit On Off OCC BW Limit 10 350 MHz OCC BW Limit On Off Back ACPR Limits ACPR Lower Adj 10 0 dB ACPR Upper Alt 10 0 dB ACPR Lower Alt 10 0 dB ACPR Upper Adj 10 0 dB ACPR Limits Ma...

Page 320: ...eep All Sweep Single Continuous Spurious Emissions On Off Spurious Segments Back Save Mask Spurious Segment 1 Segment Stop Amplitude 10 0 dBm Segment Start Amplitude 10 0 dBm Delete Current Segment Add Current Settings As New Segment Save Current Settings to Selected Segment C I Carrier Signal Type On Off Center Freq 935 000 MHz Span 300 000 kHz Pass Fail Limits On Off Back Sweep Time 1 ms Pass Fa...

Page 321: ...emod Menus Demod Type AM FM Demod 1 2 Demod Freq 10 350 MHz Demod Time 3 s Volume Set Demod Freq to Current Marker Freq Back On Off More FM Wide Band AM USB LSB FM Narrow Band Demod Type Back AM FM Demod 2 2 Back Squelch Power 120 0 dBm Beat Freq Osc 0 Hz F ООО Техэнком Контрольно измерительные приборы и оборудование www tehencom com ...

Page 322: ...ernal Delay 0 μs File Name Prefix Save Back Capture Location Span 300 000 kHz Scale 10 dB div Freq Amp Back Center Freq 935 000 MHz Reference Level 10 0 dBm Auto Atten On Off Atten Lvl 0 0 dB Capture Length 10 ms Sample Rate 12 500 MHz IQ Waveform Capture Back Start Capture Capture Mode Single Continuous Triggering File Name Location Frequency Amplitude G ООО Техэнком Контрольно измерительные приб...

Page 323: ...eep Once Sweep 10 Averages Source Displays in Zero Span Zero Span Time 100 Ps Displays in Zero Span Gated Sweep Off On Gate Polarity Rising Falling Gate Setup Back Gate Source External Gate Delay 2 ms Gate Length 500 Ps Gate View Settings Back Zero Span RBW 100 kHz Zero Span VBW 30 kHz Zero Span Time 500 Ps Back IF Power MS2720T only MS2720T MT8220T only Not allowed in Zero Span Requires Option 90...

Page 324: ...ace A Only Display All Traces Top of List Page Up Page Down Bottom of List Write Hold Limit Edit Back Back Upper Shape Square Slope Set Default Limit P Q R Limit Edit Limit Move Limit Envelope Limit Advanced On Off Frequency 1 964 718 182 GHz Amplitude 75 0 dBm Add Point Add Vertical Delete Point Next Point Left Next Point Right Limit Move P Move Limit to Current Center Freq Move Limit U D 0 0 dB ...

Page 325: ...49 Rev H Spectrum Analyzer MG Application Options Menu Figure 2 34 System Menu Application Options Submenu Keys Options Impedance 50 Ohm 75 Ohm Other Back Bias Tee Auto Ref Level Option 10 ООО Техэнком Контрольно измерительные приборы и оборудование www tehencom com ...

Page 326: ...ed by the Start Freq submenu key and enter the desired frequency using the keypad the arrow keys or the rotary knob If a start frequency higher than the current stop frequency is entered the stop frequency will be changed to yield a 10 Hz span Stop Freq Press the Freq main menu key followed by the Stop Freq submenu key and enter the desired frequency using the keypad the arrow keys or the rotary k...

Page 327: ...h are also automatically entered Channel Use the up or down arrow keys the keypad or the rotary knob to select a channel number for the selected signal standard The center of the channel is tuned to the center of the spectrum analyzer display The frequency value is the amount by which the center frequency differs from the center of the channel Step Size Offset Opens the Freq 2 2 Menu on page 2 53 ...

Page 328: ...uilt in list A user defined frequency offset either positive or negative can be entered to adjust the frequency that is displayed on the instrument from the actual swept frequency Refer to Offset Frequency on page 2 1 When enabled Offset is displayed at the bottom of the screen Figure 2 39 and the Center Freq Start Freq and Stop Freq submenu keys indicate that a frequency offset is turned on Set t...

Page 329: ...quency lower than the current start frequency is entered the start frequency will be changed to yield a 10 Hz span Span Press the Freq main menu key followed by the Span submenu key and enter the desired span Refer to Span Menu on page 2 57 Signal Standard Use the up or down arrow keys or the rotary knob to highlight a signal standard and press Enter to select When a signal standard is selected th...

Page 330: ...frequency step size Use the keypad or the rotary knob to change the Frequency Step size Channel Increment Sets the increment value for the Channel submenu key Freq Offset Enter the desired offset positive or negative using the keypad the arrow keys or the rotary knob If entering a frequency by using the keypad then the submenu key labels change to GHz MHz kHz and Hz Press the appropriate units key...

Page 331: ...Rev H Spectrum Analyzer MG Offset Example Figure 2 39 200 MHz Frequency Offset Example No Offset 200 MHz Frequency Offset Freq Step Size Offset Freq Offset Example of Frequency Offset Using the Same Source Signal ООО Техэнком Контрольно измерительные приборы и оборудование www tehencom com ...

Page 332: ...et in 1 dB steps from 1 dB per division to 15 dB per division The value can be changed using the keypad the rotary knob or the arrow keys Auto Atten On Off Input attenuation can be either tied to the reference level On or manually selected Off When input attenuation is tied to the reference level attenuation is increased as higher reference levels are selected to make sure the instrument input cir...

Page 333: ... set to Linear this method detects the average power of measurement points that go into the display point When VBW Average Type is set to Log the traditional average of log power such as dBm is displayed for the detector as well as for VBW and trace average Negative This method causes the smallest measurement point to be shown for each display point It is especially useful in zero span to see if t...

Page 334: ...e span value decreases to the nearest even value that starts with 1 2 or 5 For example if the span is 1 8 MHz then pressing the submenu key for the first time changes the span to 1 0 MHz and the next press takes the value to 500 kHz then 200 kHz and so on Full Span Pressing this button sets the span to cover the entire tunable spectrum of the instrument Zero Span This submenu key sets zero span In...

Page 335: ... Sequence Span Zero Span Note Option 89 is not available on all instrument models Refer to your instrument Technical Data Sheet Normal Press this key to select a bandwidth based on the RBW setting The selectable fixed bandwidth values listed below may differ depending on your instrument 7 MHz BW Press this button to select a fixed IF bandwidth of 7 MHz 10 MHz BW Press this button to select a fixed...

Page 336: ...range Auto VBW On Off When Auto VBW is On the instrument selects the video bandwidth based on the resolution bandwidth The ratio of video bandwidth to resolution bandwidth can be set using the RBW VBW submenu key VBW Average Type Toggles between Linear averaging arithmetic mean and Logarithmic averaging geometric mean RBW VBW This submenu key displays the ratio between resolution bandwidth and vid...

Page 337: ...ces the currently active marker on the highest signal amplitude currently displayed on screen Marker Freq to Center Moves the frequency noted by the active marker to the center frequency position and center of the display Marker to Ref Level Causes the amplitude of the currently active marker to become the reference level which is the top horizontal line of the display More Peak Options Brings up ...

Page 338: ...und the marker is placed at the right end of the trace The Peak Threshold submenu key allows the user to specify the performance of peak searching Delta Marker to Span Sets the total span width to the value of the delta marker If the delta marker is zero the span is set to zero span If the delta marker value is set to less than 10 Hz then the span will be set to 10 Hz If no delta marker is turned ...

Page 339: ... frequency of the peak to a resolution of 0 001 Hz Set Marker To Channel If a signal standard has been selected pressing this key brings up a dialog box to select a channel Select a channel number for the current signal standard and the active marker will be set to the center frequency of the channel If no signal standard has been selected a message No standard selected Press Enter or Escape to Co...

Page 340: ...e is displayed using the exponential average of each sweep Sweep Mode Pressing this submenu key opens the Sweep Mode Menu on page 2 64 The key is not valid in Zero Span Sweep Time Sets the sweep time for the measurement Auto Sweep Time When Off the measurement sweeps the time set in Sweep Time When On the instrument calculates a minimum sweep time and uses it for all subsequent sweeps Triggering A...

Page 341: ...pecifications are met No FFT Slowest sweep speed Suited for analog and pulse modulated signals Burst Detect Press to view narrow pulsed signals This function is available on MS2720T and MT8220T models only Show Help Displays a table showing the merits and trade offs of the Sweep Mode settings Back Returns to the Sweep Menu on page 2 63 Figure 2 49 SPA Sweep Mode Menu Sweep Mode Back Performance No...

Page 342: ...igger slope to rising or falling Hysteresis When used value unit is in dB Hysteresis can be used with Level and Slope when setting a measurement trigger Hysteresis is used to prevent undesired triggering when the signal is hovering near the trigger value For example the Level is set to 10 dBm the Slope is set to Rising and Hysteresis is 1 dB The first trigger occurs when the signal reaches at leas...

Page 343: ...s the trigger source The trigger level is set using the Level key in the Triggering Menu The trigger is based on the measured signal level If no signal reaches or exceeds the trigger level no trace will be displayed on the screen IF Power MS2720T Only This mode uses IF power level as the trigger source The power level is set using the Level key in the Triggering Menu The trigger is based on the me...

Page 344: ...r the trigger power level The value ranges from 150 dBm to 30 dBm Gate Polarity Selects the trigger edge to begin the gated sweep Gate Delay Sets the start of the gated sweep indicated by the left border of the blue dashed rectangle shown in the bottom graph of Figure 2 3 on page 2 7 Gate Length Sets the length of the gate and is reflected on the zero span graph by the width of the blue dashed rec...

Page 345: ...ge 2 82 Generator Opens the Generator Menu Optional on page 2 85 This submenu key is present only in spectrum analyzers with a Tracking Generator option IQ Waveform Capture Opens the IQ Waveform Capture Menu Option 24 on page 2 86 This submenu key is present only when Option 24 is installed Coverage Mapping Opens the Coverage Mapping Menu on page 6 15 This submenu key is present only when Option 4...

Page 346: ...71 Channel Power Opens the Channel Power Menu on page 2 72 ACPR Opens the ACPR Menu on page 2 73 EMF Measurement Opens the EMF Menu on page 9 2 This submenu key is present only when Option 444 is installed on your instrument Back Returns to the Measure Menu on page 2 68 Figure 2 54 Power and BW Menu Power and BW Field Strength OCC BW Channel Power ACPR EMF Measurement Back ООО Техэнком Контрольно ...

Page 347: ... the Power and BW Menu on page 2 69 Use the Antenna Options submenu keys for faster navigation through the list Display Press this key repeatedly to display All antennas only EMI antennas or only antennas marked as Favorites Select Deselect Favorite Press this submenu key to add the highlighted antenna to the Favorites list The antenna is then marked with an asterisk If the selected antenna is alr...

Page 348: ...ectional arrow keys or the rotary knob to enter the percent of power from 0 to 99 dBc Use the keypad directional arrow keys or the rotary knob to enter the dBc value 0 dBc to 100 dBc OCC BW Limit On Off Press this submenu key to turn Occupied Bandwidth Limit on and off OCC BW Limit Press this key and use the arrow keys rotary knob or numeric keypad to enter the upper limit value for the Occupied B...

Page 349: ...is labeled Center Freq With an offset other than zero the key is labeled Offset Center Freq as illustrated on the left below the full menu Refer to Section 2 27 Frequency Menu Freq 1 2 with Offset Function on page 2 51 Ch Pwr Width Sets the width for the channel power Use the keypad the directional arrow keys or the rotary knob to enter the channel power width The up and down arrow keys change the...

Page 350: ...nd adjacent channels Use the keypad the directional arrow keys or the rotary knob to enter a specific frequency When using the keypad press the GHz MHz kHz or Hz submenu key to accept the frequency input This value must be greater than or equal to half of the main channel bandwidth plus half of the adjacent channel bandwidth The up and down arrows change the frequency by the frequency step size en...

Page 351: ...d directional arrow keys or the rotary knob to change the value When using the keypad press the unit submenu key dB to accept the entered value ACPR Upper Alt Sets the ACPR upper alternate channel power value Use the numeric keypad directional arrow keys or the rotary knob to change the value When using the keypad press the unit submenu key dB to accept the entered value ACPR Lower Alt Sets the AC...

Page 352: ... menu is available only when Option 444 is installed on your instrument EMF On Off Turns EMF Measurement on and off Refer to Chapter 9 EMF Option 444 Back Returns to the Power and BW Menu on page 2 69 Figure 2 61 EMF Menu EMF On Off Automated Measurements Units Limits ICNIRP Limit On Off Trace Back ООО Техэнком Контрольно измерительные приборы и оборудование www tehencom com ...

Page 353: ...n Mask In Band Menu on page 2 77 Spurious Emissions Out of Band Opens the Spurious Emissions Out of Band Menu on page 2 78 C I Opens the C I Menu on page 2 80 Back Returns to the Measure Menu on page 2 68 Figure 2 62 Masks and C I Menu Back Masks and C I Emission Mask In Band Spurious Emissions Out of Band C I ООО Техэнком Контрольно измерительные приборы и оборудование www tehencom com ...

Page 354: ...ettings When Peak is selected the mask is moved up or down so that the mask value at the center frequency is the same as the peak value of the trace When Channel is selected the reference power value is the same as would be calculated by the Channel Power measurement over the defined channel width in this case the mask value at the center frequency is moved to the channel power measurement result ...

Page 355: ...ss the Spurious Segments submenu See Figure 2 65 on page 2 79 This key is active only when Spurious Emissions is On Auto Save Off On Full Selects the mask data Auto Save process When set to On an HTML file is saved with each segment s setup and pass fail results Auto Save Full will save two file types HTML and JPG The HTML file will contain setup information pass fail results and trace data for al...

Page 356: ...table Delete Current Segment Deletes the current segment from the Spurious Emission table Segment Start Amplitude Press this submenu key to set a value for the segment s start limit amplitude When the value is highlighted in red use the directional arrow keys rotary knob or numeric keypad to enter the amplitude value Segment Stop Amplitude Press this submenu key to set a value for the segment s st...

Page 357: ...enu key to set the frequency span using the keypad arrow keys or the rotary knob When using the numeric keypad press a unit key or press Enter for values in MHz Carrier Signal Type Press this submenu key to display the C I Signal Type Menu on page 2 81 Sweep Time Press this submenu key to set the sweep time The sweep time is displayed on the key Use the arrow keys or the rotary knob then press Ent...

Page 358: ...NB FHSS Press this submenu key to set Narrowband Frequency Hopping Spread Spectrum as the interfering signal type WB FHSS Press this submenu key to set Wideband Frequency Hopping Spread Spectrum as the interfering signal type Broadband Press this submenu key to set Broadband such as CDMA or GSM as the interfering signal type Back Returns to the C I Menu on page 2 80 without changing the currently ...

Page 359: ...r decrease the demodulation time and press the Enter key to select The demodulation time can be set from 100 milliseconds to 200 seconds The instrument sweeps one time for every demodulation period Sweeping pauses during the demodulation time Set Demod Freq to Current Marker Freq Sets the demodulation frequency to the frequency of the current marker Volume The current volume setting is displayed o...

Page 360: ...n type The red circle indicates the active selection FM Wide Band Frequency Modulation FM Narrow Band Frequency Modulation AM Amplitude Modulation USB Upper Sideband This can also be used when demodulating CW Morse code signals LSB Lower Sideband This can also be used when demodulating CW Morse code signals Back Returns to the AM FM Demod 1 2 Menu on page 2 82 Figure 2 69 SPA AM FM Demod Menu FM W...

Page 361: ...low which no signal is displayed Beat Freq Osc Sets the beat frequency of the oscillator to exactly set the demodulation frequency of USB and LSB signals Displayed only when USB or LSB is selected as the Demod Type This can also be used when demodulating CW Morse code signals Back Returns to the AM FM Demod 1 2 Menu on page 2 82 Figure 2 70 SPA AM FM Demod 2 2 Menu AM FM Demod 2 2 Back Squelch Pow...

Page 362: ...s the Tracking Generator Option on and off For more information about the Tracking Generator refer to the Tracking Generator Measurement Guide Anritsu part number 10580 00339 Back Returns to the Measure Menu on page 2 68 Figure 2 71 SPA Generator Menu Generator Output Power dBm Generator Mode CW Tracking CW Frequency GHz Back Generator Output On Off Settings Transmission Measurement ООО Техэнком К...

Page 363: ... the instrument will begin a new capture as soon as the previous one is finished Sample Rate Opens the Select Capture Sample Rate dialog Figure 2 22 Select the desired Sample Rate MHz and associated Bandwidth MHz and then press Enter Triggering Opens the IQ Capture Triggering Menu on page 2 87 to set the triggering parameters File Name Location Opens the IQ Capture Save Menu on page 2 87 to set th...

Page 364: ...s the Select Save Location dialog and Save Location menu Refer to the instrument s User Guide for additional information Filename Prefix Allows changing the prefix of the output file Files are saved with a running counter appended to this prefix Its extension is wcap For example CaptureOut0045 wcap CaptureOut is the set prefix file name and 0045 is the counter number appended to the prefix Pressin...

Page 365: ...play and can be set from 30 dBm to 150 dBm A value may be entered from the keypad use the key for a minus sign After entering the value press the dBm submenu key or the Enter key The up or down arrow keys change the reference level in 10 dB steps and the left or right arrow keys change the value by 1 dB The rotary knob changes the value by 0 1 dB per click The reference level value may be modified...

Page 366: ...9 Coverage Mapping Menu Option 431 Key Sequence Shift Measure 4 key Coverage Mapping This menu is available only when Option 431 is installed on your instrument Refer to Coverage Mapping Menu on page 6 15 ООО Техэнком Контрольно измерительные приборы и оборудование www tehencom com ...

Page 367: ...n be applied to Trace B See Trace B Ops Menu on page 2 93 Trace C Operations Lists the Trace C Ops menu to select an operation that can be applied to Trace C See Trace C Ops Menu on page 2 94 Reset Trace Resets the trace averaging Max Hold or Min Hold and restarts the sweep Trace Info Stops the current trace and displays a summary table of trace parameters and current settings See Figure 2 77 on p...

Page 368: ...Spectrum Analyzer 2 35 Trace Menu Spectrum Analyzer MG PN 10580 00349 Rev H 2 91 Figure 2 77 Trace Info ООО Техэнком Контрольно измерительные приборы и оборудование www tehencom com ...

Page 369: ... minimum value of each display point over many trace sweeps Average A Shows an exponential average of a number of traces determined by the of Averages key of Averages Sets the number of traces for use in calculating the average display value Then number used for averaging ranges from 1 to 65535 Back Returns to the Trace Menu on page 2 90 Figure 2 78 SPA Trace A Ops Menu Trace A Ops Back Normal A M...

Page 370: ...s of Trace B B C Swaps the contents of Traces B and C Max Hold B Shows the cumulative maximum value of each display point over many trace sweeps Min Hold B Shows the cumulative minimum value of each display point over many trace sweeps Back Returns to the Trace Menu on page 2 90 Figure 2 79 SPA Trace B Ops Menu Back Trace B Ops A B B C Max Hold B Min Hold B ООО Техэнком Контрольно измерительные пр...

Page 371: ...n values of live Trace A compared to a trace stored in Trace B When trace math is active a relative scale shows on the right side of the graph and is associated to Trace C This allows the user to optimize the display of Trace C without affecting the display of Trace A and Trace B Relative Ref Sets the value applied to the top graticule for the relative scale that appears on the right side of the g...

Page 372: ...lope A limit envelope is very useful when you want to easily detect new signals in the presence of other preexisting signals Use the limit envelope function to automatically create upper or lower limit lines that are based upon the on screen measured spectrum analysis values Refer to Figure 2 86 for an example limit envelope Press this submenu key to open the Limit Envelope Menu on page 2 99 Limit...

Page 373: ...Add Point submenu key description for details The up or down arrows move the amplitude by 5 of the screen height Add Point Press this submenu key to add a limit line inflection point The precise behavior of this submenu key depends upon which inflection point is active at the time that the key is pressed If the active limit point is somewhere in the middle of a multi segment limit line then a new ...

Page 374: ...nt becomes the point that is immediately to the left of the point that was deleted Next Point Left Press this submenu key to select the inflection point that is immediately to the left of the active point making this newly selected point active for editing or deletion With each key press the active point becomes that point to the left of the previously active point until the newly selected active ...

Page 375: ... dB division The submenu key displays a zero value after the limit line has been moved Move Limit L R Pressing this submenu key allows you to adjust the frequencies of the limit line All inflection points are moved by the value entered The rotary knob can also be used to make this adjustment Turn the rotary knob clockwise to move the limit line to higher frequencies The left or right arrows move t...

Page 376: ...f Limit is toggled to Lower This submenu key is used to define how far away from the measured signal the upper or lower envelope will be placed The limits are 100 dB For an upper envelope usually the value will be positive in order to place the envelope above the signal For a lower envelope the value will usually be negative in order to place the envelope below the signal Upper Shape Square Slope ...

Page 377: ...10580 00349 Rev H Spectrum Analyzer MG Square Limit Envelope Example Sloped Limit Envelope Example Figure 2 86 Square Limit Envelope Figure 2 87 Sloped Limit Envelope ООО Техэнком Контрольно измерительные приборы и оборудование www tehencom com ...

Page 378: ...r frequency Leave Limit Mirror off until half of the limit line is built then turn On Limit Mirror the other half of the limit line is built automatically Save Limit Pressing this submenu key opens a dialog to save the current upper and lower limit lines You can name the saved limit line yourself or accept the name that is suggested by the instrument which is based upon a previously saved name If ...

Page 379: ...er 8 Bias Tee Option 10 See the product Technical Data Sheet to check option availability on your instrument model Auto Ref Level The Auto Ref Level function adjusts the position of a signal on the display screen so that it is approximately two divisions down from the top if possible When the key is pressed the reference level is adjusted once Auto Ref Level may turn off the low noise front end pr...

Page 380: ...General Measurement Setups Refer to your instrument User Guide for instructions on setting up frequency span amplitude GPS limit lines markers and file management 3 3 Spectrum In Spectrum Analyzer mode smart one button measurements are built in for field strength occupied bandwidth channel power adjacent channel power ratio and carrier to interference ratio C I tests In addition AM FM SSB demodula...

Page 381: ...es 3 Press the BW main menu key and set Auto RBW and Auto VBW On or set the applicable RBW and VBW values by pressing the RBW and VBW submenu keys 4 Press the Measurements main menu key then the Spectrogram submenu key to display the spectrogram Press the Spectrogram key again to open the Spectrogram Menu 5 To change the time between sweeps press the Sweep Interval submenu key and use the rotary k...

Page 382: ...play the power and frequency at each marker position Note When the Time Cursor is activated and is not on the zero trace position the instrument will automatically stop making measurements Note Screen captured images are provided as examples The image and measurement details shown on your instrument may differ from the examples in this Measurement Guide Figure 3 1 Interference Analyzer Spectrogram...

Page 383: ...ed and uploaded into the instrument using Anritsu Master Software Tools software Procedure The following procedure demonstrates a common Interference Analyzer Signal Strength setup 1 Connect the appropriate directional antenna to the RF In port and press the Measurements main menu key 2 Press the Signal Strength submenu key to display the Signal Strength Meter Press the Signal Strength submenu key...

Page 384: ...l of the time span to a maximum of seven days After the specified time span the measurement is halted Depending upon the time interval selected the data will scroll to the left once the trace fills the screen 4 Press the Auto Scale key to automatically set the reference level and scale factor to place the trace on the screen 5 To store the RSSI data press the Record On Off submenu key to turn on d...

Page 385: ...ace the lowest signal near the bottom of the screen In general 4 dB division or 5 dB division will be good starting values 3 Press the BW main menu key and set Auto RBW and Auto VBW On or set the applicable RBW and VBW values by selecting the RBW and VBW submenu keys 4 Press the Measurements main menu key 5 Press the Signal ID submenu key to activate the measurement Press Signal ID again to list t...

Page 386: ... 3 7 4 Press the desired sweep mode submenu key Continuous Monitoring or Single Sweep and Review Figure 3 4 Interference Analyzer Signal ID All Scan Type Figure 3 5 Interference Analyzer Signal ID Freq Scan Type ООО Техэнком Контрольно измерительные приборы и оборудование www tehencom com ...

Page 387: ... is available from the Anritsu website www anritsu com With a valid GPS signal the instrument will identify the current location on the displayed map with a plus sign Saved locations are displayed with an orange square The direction of the interfering signal can be determined and recorded With two or more lines you can see where the lines intersect and estimate the location of the interferer Note ...

Page 388: ...ited Points and JPG files can be transferred and viewed on a PC Refer to Mapping Save Recall Menu on page 3 68 The actual mapping process varies based on the direction finding equipment The process is described in the following sections Interference Mapping Antenna Only on page 3 10 Interference Mapping MA2700A and Antenna on page 3 14 Save the Mapping Information on page 3 19 Note Some steps that...

Page 389: ...Set the Anritsu instrument to IA Mapping and configure the instrument A Connect a directional antenna in the frequency range of interest to the Anritsu instrument s RF In connector B Open up the Interference Analyzer by pressing the Menu key and selecting the Interference Analyzer icon or press Shift then Mode 9 highlight Interference Analysis and press Enter C Press the Measurements main menu key...

Page 390: ...on is outside the map boundaries a black arrow will indicate the direction of the current location in relation to the displayed map or 4a Recall the Default Grid option With a valid GPS signal the instrument is able to make interference mapping measurements even when an Anritsu easyMap Tools file of the current location is not available Location signal strength and bearing information can be saved...

Page 391: ... Lines submenu press the Save Current Bearing Location Direction key to save the current location and direction C Move to the next location and repeat step 5B You now have two lines on the screen and an idea of where the interfering signal is located Pan Zoom as needed if using an AZM map An example of interference mapping where approximate location of the interferer is determined is shown in Figu...

Page 392: ...urrent position 7 Status Icons Refer to Figure 6 12 on page 6 18 8 Zoom level indication when using azm maps Top is maximum zoomed in position Bottom is maximum zoomed out position Refer to Pan Zoom Menu on page 6 17 9 Current tile location in base map when using azm maps 10 Refer to Interference Mapping Menu on page 3 66 11 Plus sign indicates current position 12 Previous saved locations and bear...

Page 393: ...configure the instrument A Connect the RF cable and USB cable from the MA2700A Handheld Interference Hunter HIH to the instrument B Calibrate the MA2700A Refer to Direction Finding Menu on page 3 69 and the MA2700A User Guide C Connect a directional antenna in the frequency range of interest to the MA2700A D Setup the instrument for interference mapping mode by pressing the Menu key and selecting ...

Page 394: ...submenu key C Press Recall a Map and select the File Type AZM or MAP D Use the arrow keys to scroll down to the desired map and press Enter to select E The new map file will be displayed and the current location if within the GPS boundaries of the displayed map is shown as a plus sign F AZM maps allow zoom and pan refer to Pan Zoom Menu on page 6 17 for additional information G If the current loca...

Page 395: ...cating interfering signals The plus sign shows the current location on the screen A Press the Measurements main menu key then the Interference Mapping submenu key Note When using the default grid the coverage area for Interference Mapping is fixed at 10 miles by 10 miles The location will be centered on the default map For example if you go to the east by 15 miles then there will be an arrow indic...

Page 396: ...the Anritsu analyzer On or Off The compass acquires the bearing line data for the MA2700A Handheld Interference Hunter The compass will display a light gray T or M T for true North M for magnetic North The pitch and roll indicators will display how level and plumb the MA2700A is while searching for interference signals The compass bearing is most accurate when the MA2700A is level To the right of ...

Page 397: ...nt Anritsu instrument settings 5 GPS lock icon 6 Current position 7 Status Icons left to right Refer to Figure 6 12 on page 6 18 MA2700A USB connection USB memory stick available Map auto centering mode 8 Zoom level indication when using azm maps Top is maximum zoomed in position Bottom is maximum zoomed out position Refer to Pan Zoom Menu on page 6 17 9 Current tile location in base map when usin...

Page 398: ...nt screen will be saved The JPG file can be viewed on a PC Save KML Points Press Save Recall Points Map then Save KML Points At the Save menu select KML 2D or KML 3D then press Enter The following information is saved for the points and vectors currently displayed on the screen Signal strength dBm Bearing Setup frequency RBW VBW and detection type Current location Figure 3 11 Displaying a Saved JP...

Page 399: ...imited Points Press Save Recall Points Map then Save Tab Delimited Points At the Save menu press Enter A tab delimited text file mtd will be saved to the current location for the points and vectors currently displayed on the screen Figure 3 12 KML File on the PC and the Anritsu Instrument Note To delete existing bearings before recalling a map refer to Bearing Lines Menu on page 3 67 KML File Reca...

Page 400: ...ext editor or excel Figure 3 13 Figure 3 13 MTD File Opened in Excel Saved Points Information saved for each point includes location time signal strength bearing and instrument setup data Instrument and installed options Header Info Date format Year Month Date Day of week hour minute second ООО Техэнком Контрольно измерительные приборы и оборудование www tehencom com ...

Page 401: ...1 250 GHz Start Freq 1 930 611 500 GHz Stop Freq 1 931 666 500 GHz Channel Signal Standard A Span Step Size Offset A Back Span Span 1 000 MHz Span Up 1 2 5 Span Down 1 2 5 Full Span Zero Span Last Span BW RBW 3 MHz VBW 1 MHz RBW VBW 3 Span RBW 100 Auto RBW On Off Auto VBW On Off VBW Average Type Linear Log Zero Span RBW 3 MHz Zero Span VBW 1 MHz Freq 1 2 Offset Center Freq 1 951 250 GHz Offset Sta...

Page 402: ...od Freq to Current Marker Freq Back On Off Squelch Power 120 0 dBm Beat Freq Osc 0 Hz AM FM Demod 2 2 Back More L Generator CW Frequency 1 000 GHz Back Generator Output On Off Output Power 40 0 dBm Generator Mode CW Tracking Transmission Measurement Settings I K All Measurements Off Measure Power and Bandwidth Masks and C I AM FM Demod Generator Coverage Mapping IQ Waveform Capture L M N O P Q Mea...

Page 403: ...ord On Off RSSI Back Time Interval 70 ms Time Span 0 ms Auto Scale Reset Restart Measurement P Single Sweep and Review Continous Monitoring Scan Type All Freq Signal ID Back Scan Freq 3 550 GHz Trigger Sweep Q Reset Max Min Hold Interference Mapping Back Save Recall Points Map Bearing Lines Direction Finding Pan Zoom Sound Record On Off Spectrogram Back Sweep Interval Auto Time Cursor 0 Reset Rest...

Page 404: ...nal Compass Calibration None Bearing Lines Back Delete Last Saved Bearing Delete ALL Saved Bearings Save Current Bearing Location Direction R Pan Zoom Back Zoom In Zoom Out Shift Center Enter Center Full Zoom Shift Enter Legend Left Right Off Base Map U Mapping Save Recall Back Back Back Save Tab Delimited Points Save JPG Recall a Map Recall KML Points Only Recall KML Points With Map Recall Defaul...

Page 405: ...ce Free Run External Delay 0 μs File Name Prefix Save Back Capture Location Span 300 000 kHz Scale 10 dB div Freq Amp Back Center Freq 935 000 MHz Reference Level 10 0 dBm Auto Atten On Off Atten Lvl 0 0 dB Capture Length 10 ms Sample Rate 12 500 MHz IQ Waveform Capture Back Start Capture Capture Mode Single Continuous Triggering File Name Location Frequency Amplitude ООО Техэнком Контрольно измер...

Page 406: ...q to Center Marker to Ref Lvl Marker 1 2 3 4 5 6 More Peak Options More Delta On Off Back Marker 2 2 Marker Noise On Off Counter Marker On Off Marker Style Fixed Tracking Marker 1 Reference On Off All Markers Off Set Marker to Channel Market Table On Large Off Marker Peak Back Next Peak Left Next Peak Right Delta Marker to Span Marker Freq to Center Marker to Ref Lvl Peak Threshold 10 00 Peak Sear...

Page 407: ...o Span Time 100 ms Displays in Zero Span Gated Sweep Setup Requires Option 90 or 551 or 883 Gate View Settings Gated Sweep Off On Gate Setup Back Gate Source External Gate Delay 60 ms Gate Length 25 ms Gate View Settings Back Zero Span RBW 100 kHz Zero Span VBW 30 kHz Zero Span Time 500 ms MS2720T MT8220T only Burst Detect Back IF Power MS2720T only Zero Span only Not allowed in Zero Span Gate Pol...

Page 408: ...Trace B Only Display Trace A Only Display All Traces Top of List Page Up Page Down Bottom of List Limit Edit Back Back Upper Shape Square Slope Set Default Limit S T U Limit Edit Limit Move Limit Envelope Limit Advanced On Off Frequency 1 964 718 182 GHz Amplitude 75 0 dBm Add Point Add Vertical Delete Point Next Point Left Next Point Right Limit Move S Move Limit to Current Center Freq Offset fro...

Page 409: ...PN 10580 00349 Rev H Spectrum Analyzer MG Application Options Menu Figure 3 23 System Menu Application Options Submenu Keys Options Impedance 50 Ohm 75 Ohm Other Back Bias Tee Auto Ref Level Option 10 ООО Техэнком Контрольно измерительные приборы и оборудование www tehencom com ...

Page 410: ...lowed by the Start Freq submenu key and enter the desired frequency using the keypad the arrow keys or the rotary knob If a start frequency higher than the current stop frequency is entered the stop frequency will be changed to yield a 10 Hz span Stop Freq Press the Freq main menu key followed by the Stop Freq submenu key and enter the desired frequency using the keypad the arrow keys or the rotar...

Page 411: ...arrow keys the keypad or the rotary knob to select a channel number for the selected signal standard The center of the channel is tuned to the center of the spectrum analyzer display The frequency value is the amount by which the center frequency differs from the center of the channel Step Size Offset Opens the Freq 2 2 Menu on page 3 34 If Freq Offset is any value other than 0 Hz then the Frequen...

Page 412: ...by the Offset Start Freq submenu key and enter the desired frequency using the keypad the arrow keys or the rotary knob If a start frequency higher than the current stop frequency is entered the stop frequency will be changed to yield a 10 Hz span Offset Stop Freq Press the Freq main menu key followed by the Offset Stop Freq submenu key and enter the desired frequency using the keypad the arrow ke...

Page 413: ... frequency and the frequency step size Use the keypad or the rotary knob to change the Frequency Step size Channel Increment Sets the increment value for the Channel submenu key Freq Offset Enter the desired offset positive or negative using the keypad the arrow keys or the rotary knob If entering a frequency using the keypad the submenu key labels change to GHz MHz kHz and Hz Press the appropriat...

Page 414: ... 10580 00349 Rev H 3 35 Frequency Offset Example Figure 3 28 200 MHz Frequency Offset Example No Offset 200 MHz Frequency Offset Freq Step Size Offset Freq Offset Example of Frequency Offset Using the Same Source Signal ООО Техэнком Контрольно измерительные приборы и оборудование www tehencom com ...

Page 415: ...the submenu key is pressed the span value decreases to the nearest even value that starts with 1 2 or 5 For example if the span is 1 8 MHz pressing the submenu key for the first time changes the span to 1 0 MHz the next press takes the value to 500 kHz then 200 kHz and so on Full Span Pressing this button sets the span to cover the entire frequency range of the instrument Zero Span This submenu ke...

Page 416: ... Key Sequence Freq Span Zero Span Note Option 89 is not available on all instrument models Refer to your instrument Technical Data Sheet Normal Press this key to select a bandwidth based on the RBW setting The selectable fixed bandwidth values listed below may differ depending on your instrument 7 MHz BW Press this button to select a fixed IF bandwidth of 7 MHz 10 MHz BW Press this button to selec...

Page 417: ...be set in 1 dB steps from 1 dB per division to 15 dB per division The value can be changed using the keypad the rotary knob or the arrow keys Auto Atten On Off Input attenuation can be either tied to the reference level On or manually selected Off When input attenuation is tied to the reference level attenuation is increased as higher reference levels are selected to make sure the instrument input...

Page 418: ...Type is set to Linear this method detects the average power of measurement points that go into the display point When VBW Average Type is set to Log the traditional average of log power such as dBm is displayed for the detector as well as for VBW and trace average Negative This method causes the smallest measurement point to be shown for each display point It is especially useful in zero span to s...

Page 419: ... bandwidth range Auto VBW On Off When Auto VBW is On the instrument selects the video bandwidth based on the resolution bandwidth The ratio of video bandwidth to resolution bandwidth can be set using the RBW VBW submenu key VBW Average Type Toggles between Linear averaging arithmetic mean and Logarithmic averaging geometric mean RBW VBW This submenu key displays the ratio between resolution bandwi...

Page 420: ...opens the Spectrogram Menu on page 3 62 Signal Strength Pressing the Signal Strength submenu key sets the instrument to display signal strength When Signal Strength is active pressing the Signal Strength submenu key opens the Signal Strength Menu on page 3 63 RSSI Pressing the RSSI submenu key sets the instrument to display RSSI Received Signal Strength Indicator When RSSI is active pressing the R...

Page 421: ... page 3 54 Generator Opens the Generator Menu Optional on page 3 57 This submenu key is present only in spectrum analyzers with a Tracking Generator option IQ Waveform Capture Opens the IQ Waveform Capture Menu Option 24 on page 3 58 This submenu key is present only when Option 24 is installed Coverage Mapping Opens the Coverage Mapping Menu Option 431 on page 3 61 This submenu key is present only...

Page 422: ...3 45 Channel Power Opens the Channel Power Menu on page 3 46 ACPR Opens the ACPR Menu on page 3 47 EMF Measurement Opens the EMF Menu on page 9 2 This submenu key is present only when Option 444 is installed on your instrument Back Returns to the Spectrum Measure Menu on page 3 42 menu Figure 3 36 IA Power and BW Menu Power and BW Field Strength OCC BW Channel Power ACPR EMF Measurement Back ООО Т...

Page 423: ... Returns to the Power and BW Menu on page 3 43 Use the Antenna Options submenu keys for faster navigation through the list Display Press this key repeatedly to display All antennas only EMI antennas or only antennas marked as Favorites Select Deselect Favorite Press this submenu key to add the highlighted antenna to the Favorites list The antenna is then marked with an asterisk If the selected ant...

Page 424: ... keypad directional arrow keys or the rotary knob to enter the percent of power from 0 to 99 dBc PUse the keypad directional arrow keys or the rotary knob to enter the dBc value 0 dBc to 100 dBc OCC BW Limit On Off Press this submenu key to turn Occupied Bandwidth Limit on and off OCC BW Limit Press this key and use the arrow keys rotary knob or numeric keypad to enter the upper limit value for th...

Page 425: ... zero offset this key is labeled Center Freq With an offset other than zero the key is labeled Offset Center Freq as illustrated on the left below the full menu Refer to Frequency Menu with Offset Function on page 3 33 Ch Pwr Width Sets the width for the channel power Use the keypad the directional arrow keys or the rotary knob to enter the channel power width The up and down arrow keys change the...

Page 426: ...tween the main and adjacent channels Use the keypad the directional arrow keys or the rotary knob to enter a specific frequency When using the keypad press the GHz MHz kHz or Hz submenu key to accept the frequency input This value must be greater than or equal to half of the main channel bandwidth plus half of the adjacent channel bandwidth The up and down arrows change the frequency by the freque...

Page 427: ...eric keypad directional arrow keys or the rotary knob to change the value When using the keypad press the unit submenu key dB to accept the entered value ACPR Upper Alt Sets the ACPR upper alternate channel power value Use the numeric keypad directional arrow keys or the rotary knob to change the value When using the keypad press the unit submenu key dB to accept the entered value ACPR Lower Alt S...

Page 428: ...ement This menu is available only when Option 444 is installed on your instrument EMF On Off Turns EMF Measurement on and off Refer to Chapter 9 EMF Option 444 Back Returns to the Power and BW Menu on page 3 43 Figure 3 43 EMF Menu EMF On Off Automated Measurements Units Limits ICNIRP Limit On Off Trace Back ООО Техэнком Контрольно измерительные приборы и оборудование www tehencom com ...

Page 429: ...ts Spectrum Masks and C I Emission Mask In Band Opens the Emission Mask In Band Menu on page 3 51 C I Opens the C I Menu on page 3 52 Back Returns to the Spectrum Measure Menu on page 3 42 Figure 3 44 IA Masks and C I Menu Back Masks and C I Emission Mask In Band C I ООО Техэнком Контрольно измерительные приборы и оборудование www tehencom com ...

Page 430: ...Channel settings When Peak is selected the mask is moved up or down so that the mask value at the center frequency is the same as the peak value of the trace When Channel is selected the reference power value is the same as would be calculated by the Channel Power measurement over the defined channel width in this case the mask value at the center frequency is moved to the channel power measuremen...

Page 431: ...submenu key to set the frequency span using the keypad arrow keys or the rotary knob When using the numeric keypad press a unit key or press Enter for values in MHz Carrier Signal Type Press this submenu key to display the C I Signal Type Menu on page 3 53 Sweep Time Press this submenu key to set the sweep time The sweep time is displayed on the key Use the arrow keys or the rotary knob then press...

Page 432: ...he signal being measured is 802 11b WB FHSS Wide Band Frequency Hopping Spread Spectrum Use this setting when the signal being measured is 802 11a or 802 11g Broadband Use this setting when the signal being measured is a digital modulation format such as CDMA and GSM Back Returns to the C I Menu on page 3 52 Figure 3 47 IA C I Signal Type Menu NB FHSS Broadband WB FHSS C I Signal Type Back ООО Тех...

Page 433: ...ad directional arrow keys or the rotary knob to increase or decrease the demodulation time and press the Enter key to select The demodulation time can be set from 100 milliseconds to 500 seconds The instrument sweeps one time for every demodulation period Sweeping pauses during the demodulation time Set Demod Freq to Current Marker Freq Sets the demodulation frequency to the frequency of the curre...

Page 434: ...tes the active selection This menu provides five choices for the type of signal to be demodulated FM Wide Band Frequency Modulation FM Narrow Band Frequency Modulation AM Amplitude Modulation USB Upper Sideband This can also be used when demodulating CW Morse code signals LSB Lower Sideband This can also be used when demodulating CW Morse code signals Back Returns to the AM FM Demod 1 2 Menu on pa...

Page 435: ...it below which no signal is demodulated Beat Freq Osc Sets the beat frequency of the oscillator to exactly set the demodulation frequency of USB and LSB signals This key is active only when USB or LSB is selected as the Demod Type This can also be used when demodulating CW Morse code signals Back Returns to the AM FM Demod 1 2 Menu on page 3 54 Figure 3 50 IA AM FM Demod 2 2 Menu AM FM Demod 2 2 B...

Page 436: ...f Turns the Tracking Generator Option on and off For more information about the Tracking Generator refer to the Tracking Generator Measurement Guide Anritsu part number 10580 00339 Back Returns to the Spectrum Measure Menu on page 3 42 Figure 3 51 IA Generator Menu Generator Output Power dBm Generator Mode CW Tracking CW Frequency GHz Back Generator Output On Off Settings Transmission Measurement ...

Page 437: ...inuous the instrument will begin a new capture as soon as the previous one is finished Sample Rate Opens the Select Capture Sample Rate dialog Figure 2 22 Select the desired Sample Rate MHz and associated Bandwidth MHz and then press Enter Triggering Opens the IQ Capture Triggering Menu on page 3 59 to set the triggering parameters File Name Location Opens the IQ Capture Save Menu on page 3 59 to ...

Page 438: ...ocation Opens the Select Save Location dialog and Save Location menu Refer to the instrument s User Guide for additional information Filename Prefix Allows changing the prefix of the output file Files are saved with a running counter appended to this prefix Its extension is wcap For example CaptureOut0045 wcap CaptureOut is the set prefix file name and 0045 is the counter number appended to the pr...

Page 439: ...lay and can be set from 30 dBm to 150 dBm A value may be entered from the keypad use the key for a minus sign After entering the value press the dBm submenu key or the Enter key The up or down arrow keys change the reference level in 10 dB steps and the left or right arrow keys change the value by 1 dB The rotary knob changes the value by 0 1 dB per click The reference level value may be modified ...

Page 440: ...Rev H 3 61 Coverage Mapping Menu Option 431 Key Sequence Measurements Spectrum Coverage Mapping This menu is available only when Option 431 is installed on your instrument Refer to Coverage Mapping Menu on page 6 15 ООО Техэнком Контрольно измерительные приборы и оборудование www tehencom com ...

Page 441: ...Sweep Interval will be adjusted if currently set as Auto If the Sweep Interval setting is not Auto the maximum recording time will be limited to what will fit into the currently selected location Time Cursor The Time Cursor is used to view the spectrum at any spot in the spectrogram display Press the Time Cursor submenu key to turn on the horizontal time cursor Use the up or down arrow key to move...

Page 442: ... use of an antenna with known gain characteristics and measures the field strength over the frequency range of the antenna in units of dBm m2 dBV m dBmV m dBµV m Volt m Watts m2 dBW m2 A m dBA m or Watt cm2 On Off Turns field strength measurements on or off Antenna This submenu key displays a list box that lists all the antennas for which the instrument has data including both standard antennas an...

Page 443: ...en Auto Scale Press the Auto Scale submenu key to automatically set the reference level and scale factor to place the trace on the screen Record On Off To store the RSSI data press the Record On Off submenu key to turn on data logging Each screen full of 551 data points will be stored as a separate display and can be saved for up to seven days The instrument saves the data in instrument memory and...

Page 444: ...us Monitoring Press this submenu key to continuously sweep across the start and stop frequencies entered frequency span or scan frequency Single Sweep and Review Initially places the Signal ID feature in single sweep mode while making a single sweep for review For subsequent individual sweeps press the Trigger Sweep submenu key Trigger Sweep Press this submenu key to trigger another sweep when the...

Page 445: ...Hunter Pan Zoom Opens the Pan Zoom Menu on page 6 17 Sound Opens the DF Sound Settings Menu on page 3 70 for setting the instrument s audio Reset Max Min Hold The lower and upper limit in the graph are adjusted and updated continuously to display the highest and lowest values Press this button to reset the Max and Min values Back Returns to the Measurements Menu on page 3 41 Figure 3 60 IA Interfe...

Page 446: ...nterference Hunter Delete Last Saved Bearing Press this button to delete the last bearing line from memory The bearing line will also be removed from the map This may be repeated to delete more than one measurement Delete All Saved Bearings Press this button to remove all of the bearing lines from the screen and memory Back Returns to the Interference Mapping Menu on page 3 66 Figure 3 61 IA Beari...

Page 447: ... the Recall submenu for selecting a kml file Displays the saved locations overlaid on the current map or the default grid Recall KML Points With Map Opens the Recall submenu for selecting a kml file The map that was used when the points were saved will be recalled if it is available Recall Default Grid If you do not have a GPS embedded map but are out in the field making measurements the Recall De...

Page 448: ...ection of the offset by pressing either the Degrees Clockwise terminator button or the Degrees Counter clockwise terminator button Note Clockwise is from the top 0 to the right 90 then down 180 or 180 and then to the left 90 and back up to the top This allows the user to Correct for local magnetic anomalies that are not accounted for in the True North from Magnetic North correction Use an antenna ...

Page 449: ...eys DF Sound Settings Menu Key Sequence Measurements Interference Mapping Sound Speaker On Off Sounds a tone based on received signal strength Off mutes the speaker Volume Adjust the volume when the Speaker submenu key is On Back Returns to the Interference Mapping Menu on page 3 66 Figure 3 64 IA DF Sound Settings Menu DF Sound Settings Volume Speaker On Off Back ООО Техэнком Контрольно измерител...

Page 450: ...es the currently active marker on the highest signal amplitude currently displayed on screen Marker Freq to Center Moves the frequency noted by the active marker to the center frequency position and center of the display Marker to Ref Level Causes the amplitude of the currently active marker to become the reference level which is the top horizontal line of the display More Peak Options Brings up a...

Page 451: ...no such peak is found the marker is placed at the right end of the trace The Peak Threshold key allows the user to specify the performance of peak searching Delta Marker to Span Sets the total span width to the value of the delta marker If the delta marker is zero the span is set to 10 Hz If there is no delta marker or the delta marker value is set to less than 10 Hz then the span will be set to 1...

Page 452: ...he exact frequency of the peak to a resolution of 0 001 Hz Set Marker To Channel If a signal standard has been selected pressing this key brings up a dialog box to select a channel Select a channel number for the current signal standard and the active marker will be set to the center frequency of the channel If no signal standard has been selected a message No standard selected Press Enter or Esca...

Page 453: ...p Mode Pressing this submenu key opens the Sweep Mode Menu on page 3 75 The key is not valid in Zero Span Sweep Time Sets the sweep time for the measurement This submenu key is replaced by a Zero Span Time submenu key when the analyzer is set to Zero Span Auto Sweep Time When Off the measurement sweeps the time set in Sweep Time When On the instrument calculates a minimum sweep time and uses it fo...

Page 454: ...s all specifications are met No FFT Slowest sweep speed Suited for analog and pulse modulated signals Burst Detect Press to view narrow pulsed signals This function is available on MS2720T and MT8220T models only Show Help Displays a table showing the merits and trade offs of the Sweep Mode settings Back Returns to the Sweep Menu on page 3 74 Figure 3 69 IA Sweep Mode Menu Sweep Mode Back Performa...

Page 455: ...he trigger slope to rising or falling Hysteresis When used value unit is in dB Hysteresis can be used with Level and Slope when setting a measurement trigger Hysteresis is used to prevent undesired triggering when the signal is hovering near the trigger value For example the Level is set to 10 dBm the Slope is set to Rising and Hysteresis is 1 dB The first trigger occurs when the signal at least r...

Page 456: ...er as the trigger source The trigger level is set using the Level key in the Triggering Menu The trigger is based on the measured signal level If no signal reaches or exceeds the trigger level no trace will be displayed on the screen IF Power MS2720T Only This mode uses IF power level as the trigger source The power level is set using the Level key in the Triggering Menu The trigger is based on th...

Page 457: ...o enter the trigger power level The value ranges from 150 dBm to 30 dBm Gate Polarity Selects the trigger edge to begin the gated sweep Gate Delay Sets the start of the gated sweep indicated by the left border of the blue dashed rectangle shown in the bottom graph See Figure 2 3 on page 2 7 Gate Length Sets the length of the gate and is reflected on the zero span graph by the width of the blue das...

Page 458: ...d measurement This is not applicable to Trace B or Trace C unless trace math involving Trace A is active Trace A Operations Lists the Trace A Ops menu to select an operation that can be applied to Trace A See Trace A Ops Menu on page 3 80 Trace B Operations Lists the Trace B Ops menu to select an operation that can be applied to Trace B See Trace B Ops Menu on page 3 81 Trace C Operations Lists th...

Page 459: ...ulative minimum value of each display point over many trace sweeps Average A Shows an exponential average of a number of traces determined by the of Averages key of Averages Sets the number of traces for use in calculating the average display value Then number used for averaging ranges from 1 to 65535 Back Returns to the Trace Menu on page 3 79 Figure 3 74 IA Trace A Ops Menu Trace A Ops Back Norm...

Page 460: ... contents of Trace B B C Swaps the contents of Traces B and C Max Hold B Shows the cumulative maximum value of each display point over many trace sweeps Min Hold B Shows the cumulative minimum value of each display point over many trace sweeps Back Returns to the Trace Menu on page 3 79 Figure 3 75 IA Trace B Ops Menu Back Trace B Ops A B B C Max Hold B Min Hold B ООО Техэнком Контрольно измерител...

Page 461: ...ace A compared to a trace stored in Trace B When trace math is active a relative scale shows on the right side of the graph and is associated to Trace C This allows the user to optimize the display of Trace C without affecting the display of Traces A and B Relative Ref Sets the value applied to the top graticule for the relative scale that appears on the right side of the graph when trace math is ...

Page 462: ...Menu on page 3 86 Limit Envelope A limit envelope is very useful when you want to easily detect new signals in the presence of other preexisting signals Use the limit envelope function to automatically create upper or lower limit lines that are based upon the on screen measured spectrum analysis values Refer to Figure 3 82 for an example limit envelope Press this submenu key to open the Limit Enve...

Page 463: ... the Add Point submenu key description for details The up or down arrows move the amplitude by 5 of the screen height Add Point Press this submenu key to add a limit line inflection point The precise behavior of this submenu key depends upon which inflection point is active at the time that the key is pressed If the active limit point is somewhere in the middle of a multi segment limit line then a...

Page 464: ...tive point becomes the point that is immediately to the left of the point that was deleted Next Point Left Press this submenu key to select the inflection point that is immediately to the left of the active point making this newly selected point active for editing or deletion With each key press the active point becomes that point to the left of the previously active point until the newly selected...

Page 465: ...move the limit line by 0 2 of the screen height or 0 2 dB when the scale is set to 10 dB division Move Limit Hz Pressing this submenu key allows you to adjust the frequencies of the limit line All inflection points are moved by the value entered The rotary knob can also be used to make this adjustment Turn the rotary knob clockwise to move the limit line to higher frequencies The left or right arr...

Page 466: ... Upper Lower Offset if Limit is toggled to Lower This submenu key is used to define how far away from the measured signal the upper or lower envelope will be placed The limits are 100 dB For an upper envelope usually the value will be positive in order to place the envelope above the signal For a lower envelope the value will usually be negative in order to place the envelope below the signal Uppe...

Page 467: ... 88 PN 10580 00349 Rev H Spectrum Analyzer MG Square Limit Envelope Example Sloped Limit Envelope Example Figure 3 82 Square Limit Envelope Figure 3 83 Sloped Limit Envelope ООО Техэнком Контрольно измерительные приборы и оборудование www tehencom com ...

Page 468: ...frequency Leave Limit Mirror off until half of the limit line is built then turn On Limit Mirror The other half of the limit line is built automatically Save Limit Pressing this submenu key opens a dialog to save the current upper and lower limit lines You can name the saved limit line yourself or accept the name that is suggested by the instrument which is based upon a previously saved name If yo...

Page 469: ...Chapter 8 Bias Tee Option 10 See the product Technical Data Sheet to check option availability on your instrument model Auto Ref Level The Auto Ref Level function adjusts the position of a signal on the display screen so that it is approximately two divisions down from the top if possible When the key is pressed the reference level is adjusted once Auto Ref Level may turn off the low noise front e...

Page 470: ...atically set to the appropriate values The frequency and bandwidth settings can be manually entered using the Scan Frequencies selection if none of the available air interface standards meet the measurement need A custom channel list can also be created to allow up to 20 independent channels to be defined With the use of Master Software Tools Script Master extends the test capabilities of channel ...

Page 471: ...gnal standard 4 Press the Number of Channels submenu key and enter 20 5 Press the Amplitude main menu key and set the Reference Level and Scale so that the power of all the channels is displayed on the screen 6 Press the Measurements main menu key to activate the Measurement menu 7 If needed press the Display submenu key to select the Graph format 8 Press the Max Hold submenu key and select On or ...

Page 472: ...ghlighted Use the rotary knob or the numeric key pad to enter the desired center frequency in Hz kHz MHz or GHz 6 Press the Set Bandwidth submenu key and use the rotary knob or numeric keypad to enter the desired value in Hz kHz MHz or GHz 7 Press the Done Editing submenu key 8 Repeat steps 3 through 7 to continue editing additional channels 4 5 Custom Setup Example This example explains how to mo...

Page 473: ...Duration scanning ends and the rest of the channels are not tested Units for Scan Duration is days hours minutes and seconds with a maximum scan time of three days and a minimum scan time of ten minutes The sets of channels in the Script Master Test File can also be tested repeatedly Use the of Repeats Set submenu key to set this parameter For example if 5 were entered then each set of 20 channels...

Page 474: ...de in the custom list This choice can be changed later if needed b If Time is selected press Scan Duration to set the desired testing period Time on the submenu key turns red for editing Pressing a number on the numeric keypad lists the Time menu Press the appropriate time unit 5 If repeated set testing is desired press the of Repeats Sets submenu key and enter the desired number of test cycles 6 ...

Page 475: ...ns Time Record On Off Amplitude Reference Level 10 0 dBm Scale 10 dB div Custom Scan Back Edit List Number of Channels 10 Display Graph Table Measurements Max Hold On 5 sec Off Power Display Current Max Color Code Single Dual Channel Unit Channel Freq Back Channel Scan Signal Standard Channel 50 Number of Channels 20 Channel Step Size 1 Back Freq Scan Start Freq 580 000 kHz Freq Step Size 10 000 k...

Page 476: ...age 4 9 is listed The submenu keys allow you to import a new file or change any parameter set in the Script Master file created in Master Software Tools Figure 4 2 Channel Scanner Scanner Menu Signal Standard Opens the Signal Standards list dialog to select a signal standard Channel Opens the Channel Editor list to set a valid band in the selected signal standard Number of Channels Sets the number...

Page 477: ...ing between frequencies on the display Bandwidth The channel bandwidth can be manually entered in GHz MHz kHz or Hz Number of Channels Sets the number of channels to be displayed 1 to 20 Back Returns to the Scanner Menu on page 4 7 Figure 4 4 Channel Scanner Frequency Scan Menu Back Freq Scan Start Freq 580 000 kHz Freq Step Size 10 000 kHz Bandwidth 9 000 kHz Number of Channels 20 ООО Техэнком Ко...

Page 478: ...ration Sets the period of time channel scanning takes place for use with Repeat Scan Type of Repeats Set Sets the number of times each set of 20 channels are scanned Record On Off Turns on the record mode When the set Scans are completed or the set Time has ended the measurements will be stored to memory Start Restart Test Starts running a selected measurement or restarts a measurement that is run...

Page 479: ...l function which sets the amplitude at the top of the display Valid reference levels are from 30 dB to 130 dBm Scale Activates the scale function which sets the dB division value from 1 dB div to 15 dB div in 1 dB steps Figure 4 6 Channel Scanner Amplitude Menu Amplitude Reference Level 10 0 dBm Scale 10 dB div ООО Техэнком Контрольно измерительные приборы и оборудование www tehencom com ...

Page 480: ...y and Bandwidth for the selected item Number of Channels Sets the number of channels to be displayed 1 to 20 Back Returns to the previous menu Figure 4 7 Channel Scanner Custom Scan Menu Custom Scan Back Edit List Number of Channels 10 Set Bandwidth Edit List Select Signal Standard Set Channel Set Freq Done Editing ООО Техэнком Контрольно измерительные приборы и оборудование www tehencom com ...

Page 481: ...ay Current Max The current power units are displayed at the bottom of the channels or the maximum power is displayed activated only when Max Hold is set to On or 5 sec Color Code Single Dual Channels can be represented in one color or two alternating colors Graph Orientation Vertical Horizontal When Graph is selected in the Display submenu this key toggles the graph orientation between vertical an...

Page 482: ...nts Menu Spectrum Analyzer MG PN 10580 00349 Rev H 4 13 Figure 4 9 Channel Scanner Graph Display with Vertical Orientation Figure 4 10 Channel Scanner Table Display ООО Техэнком Контрольно измерительные приборы и оборудование www tehencom com ...

Page 483: ...sure Menu Displays the Measurements Menu on page 4 12 4 14 Trace Menu This menu is not available in Channel Scanner measurement mode 4 15 Limit Menu This menu is not available in Channel Scanner measurement mode 4 16 Other Menus Preset File Mode and System are described in the instrument User Guide ООО Техэнком Контрольно измерительные приборы и оборудование www tehencom com ...

Page 484: ...is being measured and then reduce the output amplitude until the receiver drops the signal The external splitter feeds the signal into the RF input of the instrument The display shows the output power and frequency The amplitude is set by using an external step attenuator The external splitter and attenuator are purchased separately They are available as CW Signal Generator Kit The fixed CW signal...

Page 485: ...ator to the RF Out port and the splitter to the Spectrum Analyzer RF In port as show in Figure 5 1 Figure 5 1 CW Signal Generator Configuration Power Charge 0 3 Sweep 2 Calibrate 1 Preset 6 Limit 5 Trace 4 Measure 9 Mode 8 System 7 File Shift Esc Enter Menu RF Out Adjustable Attenuator Spectrum Analyzer RF In Output Splitter ООО Техэнком Контрольно измерительные приборы и оборудование www tehencom...

Page 486: ... Procedure Spectrum Analyzer MG PN 10580 00349 Rev H 5 3 3 Press the Freq menu key to set the desired frequency Figure 5 2 CW Signal Generator Frequency Menu ООО Техэнком Контрольно измерительные приборы и оборудование www tehencom com ...

Page 487: ...ge the settings on the attenuator to adjust the power level The large knob changes the power in 10 dB steps and the small knob adjusts the power level in 1 dB steps 6 Press the Offset submenu key to add an offset in dB to the amplitude level This offset compensates for any attenuation that is placed in line between the splitter and the DUT Offset range is 100 dB to 100 dB Figure 5 3 CW Signal Gene...

Page 488: ...ent Setups Please refer to your instrument User Guide for selecting the Spectrum Analysis mode setting up frequency span amplitude GPS limit lines markers and file management 6 3 Spectrum Analysis Settings Refer to Chapter 2 Spectrum Analyzer for details and full menu overview of Spectrum Analysis measurements including bandwidth parameters sweep settings trigger types attenuator options and pream...

Page 489: ...age mapping by overlaying data directly onto the downloaded map which may be a drawing of a building Data is captured when you tap the touch screen The instrument places points linearly between taps if Time interval is used for capturing data and there is more than one measurement When the Repeat Type is Distance new measurements are placed at the next tap point Outdoor Coverage With a valid GPS s...

Page 490: ...oor map using Anritsu easyMap Tools Load the map and configure the Instrument Settings on page 6 5 Connect an antenna to the instrument and go to Map the Signal Strength on page 6 7 Save the Coverage Mapping Information on page 6 9 Note The Measurement Setup and Threshold Setting boxes can be used as menu shortcuts on touch screen instruments Use the touch screen to select the parameter to edit Fi...

Page 491: ...wnload easyMap Tools from the Anritsu website www anritsu com Additional information about easyMap Tools is available in the software Help Outdoor Map Type an address in easyMap Tools and capture the map with GPS data Indoor Map In easyMap Tools open a bitmapped image JPEG GIF TIFF or PNG of the floor plan for indoor mapping You can also use a downloaded map and make it an indoor map This method w...

Page 492: ...rack at least four satellites When it does the GPS icon at the top of the screen turns green Refer to your instrument User Guide for additional information on GPS Recall a Map Indoor or Outdoor Coverage The instrument allows you to recall a map file or azm file created with easyMap Tools With a valid GPS signal the current location will be displayed on an outdoor map or an arrow will show the dire...

Page 493: ...ing to save and recall it Alternatively you can save the KML points and view them in Google Earth or Google Maps or you can save the points in mtd mapping tab delimited format and use another tool for analysis such as Microsoft Excel Refer to Mapping Save Recall Menu on page 6 16 for additional information on recalling saved maps and kml data 1 Press the Coverage Mapping submenu key 2 Press the Sa...

Page 494: ...een 6 Press the Stop Data Collection main menu key Save the collected data as a kml file a tab delimited text file mtd or a jpg file Refer to Mapping Save Recall Menu on page 6 16 Note The default settings for coverage mapping set the internal input attenuator to 0 dB off with the preamp on and a bandwidth of 1 MHz These parameters can be adjusted depending on the strength of the signal being meas...

Page 495: ...llected data as a kml file a tab delimited text file mtd or a jpg file Refer to Mapping Save Recall Menu on page 6 16 Interior coverage mapping has two options considering that the instrument does not have location or distance information available without GPS Option 1 Set the Repeat Type to Time and walk the coverage area Press the touch screen or use the arrow keys to set the location and press ...

Page 496: ... points and vectors that are currently displayed on the screen Signal strength Setup frequency RBW VBW and detection type Current location The kml file can be recalled and viewed on the instrument Refer to Mapping Save Recall Menu on page 6 16 for information on recalling a map The kml file can also be opened and viewed using Google Earth and a network connection 1 Connect your computer or mobile ...

Page 497: ...nt to view in Google Earth See Figure 6 4 3 Click the map file name in the File column Alternatively you can select the checkbox next to the kml file name then click the Download button 4 Click Open or Save in the pop up dialog Figure 6 4 Web Remote Control Window File List Tab ООО Техэнком Контрольно измерительные приборы и оборудование www tehencom com ...

Page 498: ...rovided you have the appropriate plug in for your browser Save Tab Delimited Points In the Coverage Mapping submenu press Save Recall Points Map then Save Tab Delimited Points In the Save dialog change the file name as appropriate then press Enter A tab delimited text file mtd of the coverage mapping data currently displayed on the screen will be saved to the default location Figure 6 5 Sample Cov...

Page 499: ...g submenu press Save Recall Points Map then Save JPG In the Save dialog change the file name as appropriate then press Enter A jpg file of the current screen is saved to the default location Figure 6 6 Coverage Mapping Measurement Saved as a jpg File ООО Техэнком Контрольно измерительные приборы и оборудование www tehencom com ...

Page 500: ...ing On Off A B C A Back Mapping Save Recall Save KML Points Save JPG Recall a Map Recall KML Points Only Recall KML Points With Map Recall Default Grid Save Tab Delimited Points D Back Points Distance Time Repeat Time 100 ms Repeat Distance 0 00 m Delete ALL Points Repeat Type Time Distance Distance Units m ft Refer to Chapter 2 All Measurements Off Measure Power and Bandwidth Masks and C I AM FM ...

Page 501: ... GHz Detection E F G Detection Back RMS Avg Negative Sample Quasi peak Not Available with RSSI Peak G Back ACPR Main Ch BW 10 350 MHz Adj Ch BW 10 350 MHz Ch Spacing 10 350 MHz Adjacent Ch dB Offset 0 0 dB Good 40 0 dBm Poor 100 0 dBm F E Back RSSI Excellent 0 0 dBm Very Good 20 0 dBm Good 40 0 dBm Poor 100 0 dBm Fair 100 0 dBm C ООО Техэнком Контрольно измерительные приборы и оборудование www teh...

Page 502: ...ubmenu key to open the Measurement Setup Menu on page 6 19 and set up the instrument for RSSI or ACPR measurements Point Distance Time Setup Press this submenu key to open the Point Distance Time Setup Menu on page 6 20 and set up the Time or Distance interval for capturing data Back Returns to the Measure Menu on page 2 68 Start Stop Data Collection Press this main menu key to start collection of...

Page 503: ...type to recall Recall KML Points Only Opens the Recall submenu for selecting a KML file Displays the saved locations overlaid on the current map or the default grid Recall KML Points With Map Opens the Recall submenu for selecting a KML file The map that was used when the points were saved will be recalled if it is available Recall Default Grid If you do not have a GPS embedded map but are out in ...

Page 504: ...ertical zoom level bar a square representing the current GPS location and base map and three status icons see Figure 6 12 The zoom level indicator shows the number of levels of zoom in the AZM map with the current level displayed as a dark segment on the vertical bar Higher levels of zoom are toward the top of the indicator bar The default square with crosshairs represents a map panel with the low...

Page 505: ...ap auto centering mode locked unlocked When locked the instrument automatically displays the map tile at the zoom level that best centers the current GPS location The instrument will attempt to swap map tiles as the GPS location changes to continue displaying the current location near the center of the screen Figure 6 12 Map Legend Status Indicators 1 2 3 ООО Техэнком Контрольно измерительные приб...

Page 506: ...nob If entering a frequency using the keypad the submenu key labels change to GHz MHz kHz and Hz Press the appropriate units key Pressing the Enter key has the same effect as the MHz submenu key RBW The current resolution bandwidth value is displayed in this submenu key The RBW can be changed using the keypad the arrow keys or the rotary knob The range begins at 1 Hz and increases in a 1 to 3 sequ...

Page 507: ...mapping GPS is Off the instrument interpolates position measurements in a straight line between each pair of screen tap locations Repeat Distance When the Repeat Type is Distance and GPS is turned On for outdoor mapping use this submenu key to set the distance interval between measurements For indoor mapping GPS is Off the instrument places all new measurements at the next screen tap location Dist...

Page 508: ...s in this menu are used to set the color values for the recorded power during data collection The legend displays the entered values Back Returns to the Measurement Setup Menu on page 6 19 Figure 6 15 Coverage Mapping RSSI Menu Back RSSI Excellent 0 0 dBm Very Good 20 0 dBm Good 40 0 dBm Poor 100 0 dBm Fair 100 0 dBm ООО Техэнком Контрольно измерительные приборы и оборудование www tehencom com ...

Page 509: ... Hz submenu key to accept the frequency input This value must be greater than or equal to half of the main channel bandwidth plus half of the adjacent channel bandwidth The up or down arrows change the frequency by the frequency step size entered in the Freq Frequency Menu on page 2 49 The left or right arrow keys change the value by 10 of the span Adjacent Ch dB Offset Sets the power ratio offset...

Page 510: ...s Rate RMS Pk Pk 2 SINAD THD and Distortion Total To change X axis values to 2 kHz 5 kHz 10 kHz 20 kHz 70 kHz or 140 kHz press Audio Spectrum again and change Span When analyzing FM and PM the reference Y axis value is also scalable 3 Audio Waveform displays the time domain demodulated waveform along with Rate RMS Pk Pk 2 SINAD THD and Distortion Total measurements The X axis value can be changed ...

Page 511: ...he Center Freq submenu key to set the desired center frequency In RF Spectrum measurements press the Set Carrier Freq to Center submenu key to adjust the signal position to the center of the display screen 2 Press the Signal Standard submenu key to display the Signal Standards list Choose a signal standard and press the Enter key The current signal standard is displayed at the top of the sweep win...

Page 512: ...e Audio Demod submenu key Audio demodulation is not available for PM signals 12 In the Audio Demod menu press the On Off submenu key turn On or Off the audio demodulation function A Demod Type submenu key is available as well as a Volume submenu key 13 To save or recall setups or measurements press the Shift key and the File 7 key Setup files are saved with a stp extension and measurement files ar...

Page 513: ... also press the Adjust Range submenu key 6 Press the Measurements main menu key to choose the desired type of measurement 7 From the Measurements menu press the RF Spectrum submenu key to view the signal spectrum Press the submenu key again to set specific signal measurement functions a Press the Occ BW Method submenu key to select the preferred method of presenting the occupied bandwidth either b...

Page 514: ...e squelch level Note that RF signals below the squelch level will cause the audio waveform to be a flat line in the center of the screen 10 From the Measurements menu press the Audio Demod submenu key to listen to the audio component of the FM signal In this menu you can choose wideband or narrowband demodulation set the demodulation time and you can also set the instrument speaker volume Figure 7...

Page 515: ...squelch level Figure 7 3 Audio Summary Note Measurement values for SINAD THD and Distortion Total apply only to single tone modulation For better accuracy of these measurements the modulation rate should be at least 0 7 of IFBW If the modulation source is not single tone you can turn off these measurements by pressing the Distortion Measurements submenu key to select the Broadcast setting ООО Техэ...

Page 516: ...in AM FM PM Analyzer Menus on page 7 8 Refer to Chapter 6 Coverage Mapping Option 431 for an overview of the coverage mapping four step process Create an indoor or outdoor map using Anritsu easyMap Tools on page 6 4 Load the map and configure the Instrument Settings on page 6 5 Connect an antenna to the instrument and go to Map the Signal Strength on page 6 7 Save the Coverage Mapping Information ...

Page 517: ...s with AM FM PM Analyzer Option 509 Audio Spectrum Summary Audio Waveform Coverage Mapping Distortion Measurements Sinewave Broadcast Option 431 Required Audio Demod RF Spectrum Save Measurement Measurements IFBW 300 000 kHz Demod Type AM FM PM Auto IFBW On Off Setup Squelch Units Span Signal Standard Freq Step MHz Channel Increment Channel kHz Center Freq GHz Set Carrier Freq To Center RF Freq Po...

Page 518: ...Span Signal Standard Freq Step MHz Channel Increment Channel kHz Center Freq GHz Set Carrier Freq To Center RF Freq Back Max Span Min Span Last Span Span Up 1 2 5 Span MHz Span Down 1 2 5 RF Span Save Favorites Display All Fav Select Deselect Favorite Page Down Page Up Top of List Bottom of List Standard List ООО Техэнком Контрольно измерительные приборы и оборудование www tehencom com ...

Page 519: ... Audio Spectrum FM Back Scale milli Rad Squelch Power dBm Span Hz Audio Spectrum PM Back Scale IFBW Sweep Time s Audio Waveform Squelch Power dBm Back Scale milli Rad Sweep Time s Audio Waveform Squelch Power dBm Back Sweep Time s Audio Waveform Squelch Power dBm Back Squelch Power dBm Average Summary Audio Spectrum Summary Audio Waveform Coverage Mapping Distortion Measurements Sinewave Broadcast...

Page 520: ...USB LSB On Off Beat Freq Osc Hz Only visible when USB or LSB is selected Demod Time s Audio Demod AM Back Volume Demod Type W Bdn N Bnd On Off Demod Time s Audio Demod FM Squelch Power 120 dBm Audio Spectrum Summary Audio Waveform Coverage Mapping Distortion Measurements Sinewave Broadcast Option 431 Required Audio Demod RF Spectrum Save Measurement Measurements ООО Техэнком Контрольно измерительн...

Page 521: ...f Freq Step is the active parameter nothing happens when the arrow keys are pressed The frequency step size can be any value from 1 Hz to the upper limit of the instrument with a resolution of 1 Hz Use the keypad or the rotary knob to change the Frequency Step size Signal Standard Press to select a signal standard from the list of available standards You can edit this list of Signal Standards by u...

Page 522: ...Hz 2 MHz 5 MHz and 10 MHz Each press of this submenu key increases the span to one of these listed values Span Down Press to decrease the Span If starting at 5 MHz then span decreases to 2 MHz 1 MHz 500 kHz 200 kHz 100 kHz 50 kHz 20 kHz and 10 kHz Each press of this submenu key decreases the span to one of these listed values Max Span Press to set the span to 10 MHz the maximum value Min Span Pres...

Page 523: ...n the Signal Standards list box Save Favorites Press to save any selections or de escalations in the list Top of List Press to move the list display to show the first top of list standards Page Up Press to move through the list one page at a time Page Down Press to move through the list one page at a time Bottom of List Press to move the list display to show the last bottom of list standards Figur...

Page 524: ... numeric keypad then press the Enter key Power Offset Press to set the power offset in dB Use the rotary knob the arrow keys or the numeric keypad then press the Enter key Adjust Range Press to change the reference level if the signal strength is too high ADC error or too low Figure 7 12 Amplitude Menu Power Offset dB Scale dB div Adjust Range RF Amplitude ООО Техэнком Контрольно измерительные при...

Page 525: ...eys or the rotary knob to set the value The available values for IFBW are 1 kHz 3 kHz 10 kHz 30 kHz 100 kHz and 300 kHz Auto IFBW On Off Press to turn On or Off the automatic selection of the intermediate frequency bandwidth IFBW The selection toggles between the two choices and the current setting is underlined on the submenu key Squelch Units Press to select whether the Squelch level is set in d...

Page 526: ...y face is red when the measurement is active When the circle is red press this submenu key again to open the Audio Waveform menu Summary Press to view a summary of the RF Spectrum Audio Spectrum and Audio Waveform measurements The circle on the submenu key face is red when the measurement is active The results are displayed in table format Coverage Mapping Press to open the Coverage Mapping Menu o...

Page 527: ...ter than the dBc that is set with the dBc submenu key The selection toggles through the choices and the current setting is underlined on the submenu key Press to set the percent for the Occupied BW calculation if the selected Occ BW Method is Int Pwr dBc Press to set the dBc for the Occupied BW calculation if the selected Occ BW Method is dBc Back Press to return to the Measurements menu Figure 7 ...

Page 528: ... the AM audio spectrum display Use the numeric keypad the rotary knob or the arrow keys to set the value Valid values are 2 kHz 5 kHz 10 kHz 20 kHz 70 kHz and 140 kHz Squelch Power Press to set the squelch power level Back Press to return to the Measurements menu Figure 7 16 Audio Spectrum AM Menu Back Span Hz Squelch Power dBm Audio Spectrum AM ООО Техэнком Контрольно измерительные приборы и обор...

Page 529: ...e sweep time for the AM audio waveform display If you use the numeric keypad to enter a value then the submenu keys change to Time in units of min s ms or µs Squelch Power Press to set the squelch power level Back Press to return to the Measurements menu Figure 7 17 Audio Waveform AM Menu AM Back Sweep Time s Audio Waveform Squelch Power dBm ООО Техэнком Контрольно измерительные приборы и оборудов...

Page 530: ... the value Valid values are 2 kHz 5 kHz 10 kHz 20 kHz 70 kHz and 140 kHz Scale IFBW Press to set the vertical scale in percent of intermediate frequency bandwidth IFBW Use the numeric keypad the rotary knob or the arrow keys to set the percent value Squelch Power Press to set the squelch power level Back Press to return to the Measurements menu Figure 7 18 Audio Spectrum FM Menu Back Scale IFBW Sq...

Page 531: ... The output turns On at the level that has been set with the Output Power submenu key The current state Off or On is underlined Scale IFBW Press to set the vertical scale in percent of intermediate frequency bandwidth IFBW Use the numeric keypad the rotary knob or the arrow keys to set the percent value Squelch Power Press to set the squelch power level Back Press to return to the Measurements men...

Page 532: ...arrow keys to set the value Valid values are 2 kHz 5 kHz 10 kHz 20 kHz 70 kHz and 140 kHz Scale milli Rad Press to set the vertical scale in milliradians Use the numeric keypad the rotary knob or the arrow keys to enter a value Squelch Power Press to set the squelch power level Back Press to return to the Measurements menu Figure 7 20 Audio Spectrum PM Menu Back Scale milli Rad Squelch Power dBm S...

Page 533: ...to enter a value then the submenu keys change to Time in units of min s ms or µs Scale milli Rad Press to set the vertical scale in milliradians Use the numeric keypad the rotary knob or the arrow keys to enter a value Squelch Power Press to set the squelch power level Back Press to return to the Measurements menu Figure 7 21 Audio Waveform PM Menu Back Scale milli Rad Squelch Power dBm Sweep Time...

Page 534: ...y to open the Measurement Setup Menu on page 7 27 and select the coverage measurement type and threshold values Point Distance Time Setup Press this submenu key to open the Point Distance Time Setup Menu on page 7 28 and set up the Time or Distance interval for capturing data Back Returns to the Measurements Menu on page 7 17 Start Stop Data Collection Press this main menu key to start coverage ma...

Page 535: ...l KML Points Only Opens the Recall menu for selecting a kml file Displays the saved locations overlaid on the current map or the default grid Recall KML Points With Map Opens the Recall menu for selecting a kml file The map that was used when the points were saved will be recalled if it is available Recall Default Grid If you do not have a GPS embedded map but are out in the field making measureme...

Page 536: ...surements Each threshold corresponds to a specific mapping point color during coverage mapping Figure 7 4 on page 7 7 Threshold values can also be changed with the touch screen by pressing on one of the color boxes in the map legend Carrier Power Thresholds Press this button to select the threshold values for Carrier Power measurements Each threshold corresponds to a specific mapping point color d...

Page 537: ...n measurements For indoor mapping GPS is Off the instrument interpolates position measurements in a straight line between each pair of screen tap locations Repeat Distance When the Repeat Type is Distance and GPS is turned On for outdoor mapping use this submenu key to set the distance interval between measurements For indoor mapping GPS is Off the instrument places all new measurements at the nex...

Page 538: ...her For example if the demodulation time is chosen as 3 seconds then one complete sweep of graph display occurs followed by 3 seconds of audio playback followed by one sweep of graph display followed by 3 seconds of audio playback and so on Beat Freq Osc Sets the beat frequency of the oscillator to exactly set the demodulation frequency of USB and LSB signals Displayed only when USB or LSB is sele...

Page 539: ...Time in units of min s ms or µs Demodulation time denotes the audio playback time Audio playback and the graph display occur one after the other For example if the demodulation time is chosen as 3 seconds then one complete sweep of graph display occurs followed by 3 seconds of audio playback followed by one sweep of graph display followed by 3 seconds of audio playback and so on Volume Press to se...

Page 540: ...noted by the active marker to the center frequency position and the center of the sweep window Marker to Ref Lvl Press to set the amplitude of the currently active marker as the reference level which is the top horizontal line in the sweep window Marker Table On Large Off Press to turn On or Off the marker table which is displayed below the sweep window Large is not functional in AM FM PM mode The...

Page 541: ...7 21 Marker Menu AM FM PM Analyzer Option 509 7 32 PN 10580 00349 Rev H Spectrum Analyzer MG ООО Техэнком Контрольно измерительные приборы и оборудование www tehencom com ...

Page 542: ...e receivers and can also be used to power some tower mounted amplifiers The bias can be turned on only when the instrument is in transmission measurement return loss cable loss VSWR DTF Spectrum Analyzer Channel Scanner and Interference Analyzer mode When bias is turned on the bias voltage and current are displayed in the lower left corner of the display The 12 VDC to 32 VDC power supply is design...

Page 543: ...e 8 1 Variable Bias Tee Power MT8220TBTS Analyzer Charge File 7 System 8 Shift Esc Mode 9 Meas 4 Trace 5 Limit 6 Preset 1 Cal 2 Sweep 3 Menu Enter Touch 1 RF OUT RF IN TMA DD ANT RX TX Bias Tee ООО Техэнком Контрольно измерительные приборы и оборудование www tehencom com ...

Page 544: ...e Press this submenu key to set the power supply voltage The current Bias Tee voltage selection is shown in red near the top of the graticule Current Press this submenu key to toggle the bias tee current between Low and High Back Press this submenu key to return to the previous menu Figure 8 2 Bias Tee Menu Bias Tee Off On Current Low High Back Bias Tee Bias Tee Voltage 16 1 V ООО Техэнком Контрол...

Page 545: ...8 2 Bias Tee Menu Bias Tee Option 10 8 4 PN 10580 00349 Rev H Spectrum Analyzer MG ООО Техэнком Контрольно измерительные приборы и оборудование www tehencom com ...

Page 546: ...d spectrum analyzer technical data sheets 9 2 Connecting the Antenna 1 Connect the antenna RF connector to the Analyzer RF In port on the instrument See Figure 9 1 The antenna connector must be finger tight 2 Connect the antenna USB connector to one of the USB Type A ports on the instrument Note Not all instrument models offer every option Please refer to the Technical Data Sheet of your instrumen...

Page 547: ...et up EMF parameters and start the measurement EMF must be turned On Limits This is a shortcut to the standard spectrum analyzer Limits menu Shift Limit 6 For EMF measurements only the upper limit line is used for testing the pass fail condition Multi segment limit lines can also be created ICNIRP Limit On Off Turning this On creates a limit line consistent with the guidelines of the International...

Page 548: ...max and min of these isotropic results every 3 s The displayed values are computed from all measurements completed thus far within the measurement time At the end of the measurement time the Current row is cleared and the Total row is updated with the max min and running average of all isotropic results 20 in this example Number of Measurements Sets the number of EMF measurements to complete from ...

Page 549: ...esult from trace averaging Volts on a linear scale This is the running average of the individual isotropic measurements completed within the specified measurement time View Blank Toggles the selected trace between View and Blank state Two or all three traces can be viewed simultaneously by selecting each trace and setting its state to View Selecting Blank will blank the currently selected trace Ba...

Page 550: ...ion See Figure 9 5 The average value is computed as sum of the 551 trace point amplitudes 551 The Current row displays values computed for all measurements completed thus far as indicated by Measurement Number 2 5 for example at the bottom of the table At the end of the specified measurement time the current max min and average values are copied to the Total row The Current row is then cleared for...

Page 551: ...ded and the Current Test Status in the summary table is updated to FAIL In that case the Final Test Result is immediately displayed as a FAIL If the Average Isotropic Result does not cross the limit line then the Current Test Status is updated to PASS and stays this way for a few sweeps The Current Test Status is then updated to See Figure 9 5 on page 9 5 If all of the measurements pass the Final ...

Page 552: ...B Bias Tee 8 1 menu 8 3 burst detect 2 3 2 64 3 75 BW menu interference analyzer 3 40 spectrum analyzer 2 59 C C I menu interference analyzer 3 52 spectrum analyzer 2 80 C I Signal Type menu interference analyzer 3 53 spectrum analyzer 2 81 calculations antenna 2 15 Carrier to Interference ratio C I 2 26 channel power 2 18 GSM 2 18 Channel Power menu interference analyzer 3 46 spectrum analyzer 2 ...

Page 553: ...signal strength 3 4 spectrogram 3 2 Interference Mapping menu 3 66 3 67 IQ capture 2 37 2 86 3 58 IQ Capture Freq Amp menu interference analyzer 3 60 spectrum analyzer 2 88 IQ Capture Triggering menu spectrum analyzer 2 87 3 59 IQ waveform capture 2 37 IQ Waveform Capture menu spectrum analyzer 2 86 3 58 Isotropic antenna 9 1 L Limit Advanced menu interference analyzer 3 89 spectrum analyzer 2 101...

Page 554: ...overage Mapping ACPR 6 22 Coverage Mapping 6 15 Mapping Save Recall 6 16 Measurement Setup 6 19 Pan and Zoom 6 17 Point Distance Time Setup 6 20 RSSI 6 21 menu Interference Analyzer ACPR 3 47 AM FM Demod 1 2 3 54 AM FM Demod 2 2 3 56 Amplitude 3 38 Bias Tee 8 3 BW 3 40 C I 3 52 C I Signal Type 3 53 Capture Triggering IQ 3 59 Channel Power 3 46 Demod Type 3 55 Detection 3 39 Edit 3 84 EMF 3 49 Fiel...

Page 555: ...l Scanner 4 6 Coverage Mapping 6 13 Interference Analyzer 3 22 limit SPA 2 47 Marker SPA 2 40 Measurements IA 3 23 Measurements SPA 2 41 Spectrum Analyzer 2 39 sweep SPA 2 46 trace SPA 2 47 O OCC BW menu interference analyzer 3 45 spectrum analyzer 2 71 occupied bandwidth OBW AM FM PM analyzer 7 18 channel power meas t example 2 17 interference analyzer menu 3 45 spectrum analyzer measurement 2 16...

Page 556: ...r 3 36 spectrum analyzer 2 57 Span RBW ratio 2 2 spectrogram 3 2 Spectrogram menu interference analyzer 3 62 Spectrum Analyzer menu maps 2 39 Spectrum Measure menu interference analyzer 3 42 spurious emission in band 2 24 out of band 2 22 2 30 create mask segment 2 30 load mask 2 32 measurements 2 34 2 78 modify mask segment 2 32 Standard List menu AM FM PM 7 14 Sweep menu interference analyzer 3 ...

Page 557: ...80 00349 Rev H Spectrum Analyzer MG Z Zero Span key 2 57 3 36 menu interference analyzer 3 37 menu spectrum analyzer 2 58 option 89 IF output 2 4 ООО Техэнком Контрольно измерительные приборы и оборудование www tehencom com ...

Page 558: ...ООО Техэнком Контрольно измерительные приборы и оборудование www tehencom com ...

Page 559: ...0 Jarvis Drive Morgan Hill CA 95037 2809 USA http www anritsu com Anritsu utilizes recycled paper and environmentally conscious inks and toner ООО Техэнком Контрольно измерительные приборы и оборудование www tehencom com ...

Page 560: ...re combined as a single option GSM GPRS EDGE Option 880 W CDMA HSPA Option 881 TD SCDMA HSPA Option 882 LTE LTE A FDD and TDD Option 883 Note Not all instrument models offer every option or every measurement within a given option Please refer to the Technical Data Sheet of your instrument for available options and measurements within the options Anritsu Company 490 Jarvis Drive Morgan Hill CA 9503...

Page 561: ...roperty of Anritsu Company and any unauthorized use or disclosure of these drawings specifications and information is prohibited they shall not be reproduced copied or used in whole or in part as the basis for manufacture or sale of the equipment or software programs without the prior written consent of Anritsu Company UPDATES Updates if any can be downloaded from the Anritsu Website at http www a...

Page 562: ...angerous condition or procedure that could result in serious injury or death and possible loss related to equipment malfunction Follow all precautions and procedures to minimize this risk Warning This indicates a risk from a hazardous condition or procedure that could result in light to severe injury or loss related to equipment malfunction Follow all precautions and procedures to minimize this ri...

Page 563: ... to precision components Caution Electrostatic Discharge ESD can damage the highly sensitive circuits in the instrument ESD is most likely to occur as test devices are being connected to or disconnected from the instrument s front and rear panel ports and connectors You can protect the instrument and test devices by wearing a static discharge wristband Alternatively you can ground yourself to disc...

Page 564: ... GPRS EDGE RF Measurements 2 2 2 4 Measurement Display 2 2 2 5 Demodulator 2 5 2 6 GSM GPRS EDGE Mode Pass Fail 2 7 Pass Fail Mode Procedure 2 7 2 7 Measurement Results 2 8 2 8 GSM GPRS EDGE Menus 2 10 2 9 Freq Frequency Menu 2 11 2 10 Amplitude Menu 2 12 2 11 Setup Menu 2 12 2 12 Measurements Menu 2 13 Spectrum Menu 2 14 Demodulator Menu 2 15 Pass Fail Mode Menu 2 16 2 13 Marker Menu 2 17 2 14 Sw...

Page 565: ...8 ACLR Measurement Setup 3 9 ACLR Measurement Procedure 3 9 ACLR Multi channel ACLR Procedure 3 11 Spectral Emission Mask Setup 3 11 Spectral Emission Mask Procedure 3 12 RF Summary 3 13 3 5 Demodulator 3 14 Zoom Function 3 14 Code Domain Power CDP Setup 3 14 Code Domain Power CDP Procedure 3 15 HSPA Setup 3 17 HSPA Procedure 3 17 Codogram Setup 3 18 Codogram Procedure 3 18 3 6 Over the Air Measur...

Page 566: ... 3 41 3 13 Marker Menu 3 42 3 14 Sweep Menu 3 42 3 15 Measure Menu 3 43 3 16 Trace Menu 3 43 3 17 Limit Menu 3 43 3 18 Other Menus 3 43 Chapter 4 TD SCDMA HSPA Signal Analyzer 4 1 Introduction 4 1 4 2 General Measurement Setups 4 1 4 3 TD SCDMA HSPA RF Measurements 4 1 Measurement Setup 4 2 Channel Spectrum 4 3 Power versus Time 4 4 RF Summary 4 6 4 4 TD SCDMA HSPA Demodulator 4 7 Measurement Setu...

Page 567: ...Pass Fail Mode Menu 4 26 4 12 Sweep Menu 4 27 4 13 Measure Menu 4 27 4 14 Trace Menu 4 27 4 15 Limit Menu 4 27 4 16 Other Menus 4 27 Chapter 5 LTE Signal Analyzer 5 1 Introduction 5 1 5 2 General Measurement Setups 5 1 Antenna Status 5 2 5 3 LTE RF Measurements 5 3 Channel Spectrum 5 3 ACLR 5 3 Spectral Emission Mask 5 3 RF Summary 5 3 RF Measurement Setups 5 4 5 4 LTE Modulation Measurements 5 8 ...

Page 568: ...8 5 10 Amplitude Menu 5 29 5 11 Setup Menu 5 30 5 12 Measurements Menu 5 31 RF Menu 5 32 Modulation Menu 5 33 Power vs Resource Block Menu 5 34 Constellation Menu 5 35 Control Channel Power Menu 5 36 Over the Air Menu 5 37 OTA Scanner Menu 5 38 Over the Air Tx Test Menu 5 39 Coverage Mapping Menu 5 40 Carrier Aggregation Menu 5 41 Component Carrier Menu 5 42 EMF Menu 5 42 Pass Fail Test Menu 5 43 ...

Page 569: ...l Power 6 11 Tx Time Alignment 6 11 Modulation Summary 6 11 Modulation Measurement Setups 6 12 6 5 TD LTE Over the Air OTA Measurements 6 17 Antenna Status 6 17 Scanner 6 17 Tx Test 6 18 Mapping Coverage Mapping 6 18 Carrier Aggregation 6 18 EMF Option 444 only 6 19 Measurement Setup 6 19 6 6 Pass Fail Tests 6 22 6 7 TD LTE Summary 6 23 Measurement Setup 6 24 6 8 TD LTE Menus 6 25 TD LTE Menus con...

Page 570: ...Component Carrier Menu 6 46 EMF Menu 6 46 Pass Fail Test Menu 6 47 6 13 Marker Menu 6 48 Power vs Resource Block Marker Menu 6 49 6 14 Calibrate Menu 6 49 6 15 Sweep Menu 6 49 6 16 Measure Menu 6 50 6 17 Trace Menu 6 50 6 18 Limit Menu 6 50 6 19 Other Menus 6 50 Chapter 7 LTE and TD LTE Coverage Mapping 7 1 Introduction 7 1 7 2 General Measurement Setups 7 1 7 3 Coverage Mapping 7 1 Anritsu easyMa...

Page 571: ...Meas Params Menu LTE TD LTE 8 3 RS Display Menu 8 4 P SS Display Menu 8 5 S SS Display Menu 8 6 Measurement Results LTE TD LTE 8 7 Pass Fail 8 9 8 4 W CDMA EMF Menu 8 10 Meas Params Menu W CDMA 8 12 Display Menu 8 13 Measurement Results W CDMA 8 14 Pass Fail 8 15 Appendix A Error Messages A 1 Introduction A 1 A 2 3GPP Messages A 1 Warning Messages A 1 Notifications A 1 A 3 LTE Messages A 2 A 4 TD ...

Page 572: ...in Chapter 3 W CDMA HSPA Signal Analyzer Option 44 W CDMA HSPA RF Measurements Option 45 W CDMA Demodulation Option 65 W CDMA HSPA Demodulation Option 35 W CDMA HSPA Over the Air OTA Measurements Option 881 W CDMA HSPA Measurements requires Option 9 TD SCDMA HSPA TD SCDMA HSPA signal analysis is described in Chapter 4 TD SCDMA HSPA Signal Analyzer Option 60 TD SCDMA HSPA RF Measurements Option 61 ...

Page 573: ... LTE LTE A Modulation Measurements Option 556 TD LTE LTE A OTA Measurements requires Options 31 and 552 for full functionality Option 883 LTE LTE A FDD TDD Measurements LTE and TD LTE coverage mapping is described in Chapter 7 LTE and TD LTE Coverage Mapping EMF measurements in the LTE and TD LTE Signal Analyzer modes are described in Chapter 8 EMF Option 444 1 3 Selecting a Measurement Mode Selec...

Page 574: ...vide online feedback complete a Talk to Anritsu form to have your questions answered or obtain other services offered by Anritsu Updated product information can be found on the Anritsu website http www anritsu com Search for the product model number The latest documentation is on the product page under the Library tab Note Screen captured images are provided as examples The image and measurement d...

Page 575: ...1 4 Contacting Anritsu General Information 1 4 PN 10580 00234 Rev T 3GPP MG ООО Техэнком Контрольно измерительные приборы и оборудование www tehencom com ...

Page 576: ...ny GSM GPRS EDGE base station for accurate measurements When a physical connection is not available or required the instrument can receive and demodulate GSM GPRS EDGE signals over the air GSM GPRS EDGE RF measurements provide views of spectrum power versus time frame power versus time slot with mask and summary screens The spectrum view displays channel spectrum and multi channel spectrum The cha...

Page 577: ...ect the GSM or EDGE signal 3 The instrument has automatic external reference frequency detection or if equipped activate GPS to get GPS High Accuracy frequency error measurements Refer to the User Guide for GPS setup information 2 4 Measurement Display Press the Measurements main menu key to select measurement display options To display Spectrum press the Spectrum submenu key Press the Channel Spe...

Page 578: ...alyzer 2 4 Measurement Display 3GPP MG PN 10580 00234 Rev T 2 3 Figure 2 1 GSM Single Channel Measurement Figure 2 2 GSM Multi Channel Measurement ООО Техэнком Контрольно измерительные приборы и оборудование www tehencom com ...

Page 579: ... Figure 2 3 To display Power versus Time Slot press the Power versus Time Slot submenu key to activate the Power versus Time Slot measurement Figure 2 4 The mask is according to the 3GPP TS 05 05 specification The first slot information is displayed Figure 2 3 GSM Power vs Time Frame Measurement Figure 2 4 GSM Power vs Time Slot Measurement ООО Техэнком Контрольно измерительные приборы и оборудова...

Page 580: ...ically select the GSM or EDGE signal 4 The instrument has automatic external reference frequency detection or if equipped activate GPS to get GPS High Accuracy frequency error measurements Refer to the User Guide for GPS setup information 5 Press the Measurements main menu key 6 Press the Demodulator submenu key Note Highlight GSM or EDGE to set the instrument to measure only a GSM or EDGE signal ...

Page 581: ...0580 00234 Rev T 3GPP MG To display the GSM EDGE Summary screen Figure 2 7 press the GSM EDGE Summary soft key Figure 2 6 EDGE Demodulator Measurement Figure 2 7 GSM EDGE Summary ООО Техэнком Контрольно измерительные приборы и оборудование www tehencom com ...

Page 582: ...d and downloaded to the instrument All measurement parameters can be selected for pass fail testing Pass Fail Mode Procedure 1 Set the frequency as described in the User Guide 2 Press the Measurements main menu key 3 Press the Pass Fail Mode submenu key to activate Pass Fail Mode 4 Press the Pass Fail Mode submenu key to display the Pass Fail Mode menu and then press the Select Pass Fail Test subm...

Page 583: ...is the Base Station Identity Code broadcasted on GSM systems The code consists of a Network Color Code NCC and a Base Station Color Code BCC Phase Err RMS deg The RMS phase error measured in degrees between the received signal and an ideal reconstructed reference signal of the first active slot Phase Err Pk deg The peak phase error measured in degrees between the received signal and an ideal recon...

Page 584: ... dB This value is an estimate that is derived from the measured RMS EVM value This measurement is applicable to an EDGE signal only Modulation Type The modulation type can be GMSK for GSM signals or 8PSK for EDGE signals Mag Err rms The RMS of the magnitude error between the received signal and an ideal reconstructed reference signal of the first active slot in ООО Техэнком Контрольно измерительны...

Page 585: ...nter Freq 1 000 GHz Signal Standard Channel Set CF To Closest Channel Decrement Channel Increment Channel Measurements Spectrum Power vs Time Frame Power vs Time Slot Demodulator Pass Fail Mode GSM EDGE Summary Save Measurement Spectrum Multi Channel Spectrum Channel Spectrum Back Demodulator I Q View Vector Const Back Pass Fail Mode ScriptMaster Select Pass Fail Test Back ScriptMaster Change File...

Page 586: ... of the selected standard is automatically tuned Other settings such as channel spacing and integration bandwidth are also automatically entered Appendix A contains a table of the signal standards that are in the instrument firmware Channel Use the Up Down arrow keys the keypad or the rotary knob to select a channel number for the selected signal standard The center of the channel is automatically...

Page 587: ...0 dB in Ext Gain is the same as 1 0 db of Ext Loss By default the instrument will automatically change attenuation preamplifier and digital gain settings to make the best GSM measurements Auto Range Press this submenu key to toggle the Auto Range function between On and Off When set to On the instrument adjusts the reference level automatically for each sweep Adjust Range Press this submenu key to...

Page 588: ... Offset C I are not measured for GSM signals shows N A on the display Pass Fail Mode Opens the Pass Fail Mode Menu on page 2 16 Displays the Pass Fail measurements in a table format with clear pass or fail indicators that include min max thresholds and actual measured results GSM EDGE Summary Displays the measurement results in a table format Save Measurement Opens a dialog window to name and save...

Page 589: ...shown below Channel Cursor Select Channel Cursor to place the cursor at a specific channel location Use the rotary knob or the Up Down arrow keys to select the channel Press the Enter key to select Freq Cursor Select Freq Cursor to place the cursor at a specific frequency Use the rotary knob or the Up Down arrow keys to select the frequency Press the Enter key to select Back Returns to the Spectru...

Page 590: ...odulator Menu Key Sequence Measurements Demodulator I Q View Allows selection between Vector or Const Back Returns to the Measurements Menu Figure 2 15 GSM GPRS EDGE Freq Menu Demodulator I Q View Vector Const Back ООО Техэнком Контрольно измерительные приборы и оборудование www tehencom com ...

Page 591: ...and the ScriptMaster menu is listed Start Test Begins running the instructions listed in ScriptMaster Change File Header Opens the Pass Fail Test File Header entry window and lists the Text Entry menu to name the saved file after the ScriptMaster measurement process is complete Skip Skips over a ScripMaster instruction Exit Ends the ScriptMaster measurement process Returns the instrument to the pr...

Page 592: ...GPRS EDGE measurement mode 2 18 Other Menus Preset File Mode and System are described in the instrument User Guide Sweep Single Continuous This submenu key toggles between continuous sweep and single sweep In single sweep mode the results of a sweep are displayed on the screen while the instrument awaits a trigger event to start a new sweep Trigger Sweep Pressing this submenu key causes the instru...

Page 593: ...2 15 Measure Menu GSM GPRS EDGE Signal Analyzer 2 18 PN 10580 00234 Rev T 3GPP MG ООО Техэнком Контрольно измерительные приборы и оборудование www tehencom com ...

Page 594: ...MA signal over the air connect the appropriate frequency band antenna to the RF In connector To connect the node B equipment directly connect the power amplifier of the node B equipment to the RF In connector of the unit using a coupler or attenuator Note The W CDMA HSPA Demodulator option demodulates both W CDMA and HSPA signals Refer to the instrument Technical Data Sheet for option availability...

Page 595: ...Table 3 1 Note Use an applicable band pass filter to eliminate out of band signals that can cause mixer saturation Table 3 1 Channel Power Colors Parameter Description Color VIewable on Display CPICH Common Pilot Channel Red All CDP views P CCPCH Primary Common Control Physical Channel Magenta All CDP views S CCPCH Secondary Common Control Physical Channel Cyan All CDP views PICH Paging Indicator ...

Page 596: ...curacy and is typically useful only with a good external frequency reference Codogram When Codogram is selected the screen displays the changes in code power levels over time Noise Floor The average power of inactive codes in the code domain as displayed in the CDP measurement display Threshold The Active Channel Threshold Level can be set to indicate which code channels are considered active Any ...

Page 597: ... in OTA measurement displays Pilot Dominance The strength of the strongest pilot compared to the next strongest pilot in the same channel This should be 10 dB in order to make good measurements OTA Total Power The total channel power is also called Io and displayed in dBm CPICH Power CPICH power is the power of the Common Pilot Channel power displayed in dBm P CCPCH Power P CCPCH power is the Prim...

Page 598: ...data symbol is called the Spreading Factor The lower the spreading factor the higher the data rate According to the 3GPP standard the spreading factor can vary from 4 to 512 and the maximum spreading factor is either 256 or 512 The instrument can be set to 256 or 512 maximum spreading factors To set up the maximum spreading factor 1 Press the Setup main menu key 2 Press the Max Spreading Factor su...

Page 599: ...p main menu key then press More 2 Press the Threshold submenu key and select Auto or Manual 3 To set the threshold level manually press the Manual Threshold submenu key and use the rotary knob arrow keys or the numeric keypad to change the value When entering a threshold using the keypad the screen menu will show the Units key Press the dB submenu key or the Enter key to set the entered threshold ...

Page 600: ...Channel Number can also be directly entered using the numerical keypad Band Spectrum Procedure 1 Set the measurement frequency by using one of the methods listed in the User Guide 2 Press the Measurements main menu key and the RF Measurements submenu key 3 Press the Band Spectrum submenu key to display the band spectrum Figure 3 1 Note Screen captured images are provided as examples The image and ...

Page 601: ...displays the measurements for the selected signal Channel Spectrum Procedure 1 Press the Setup main menu key 2 The instrument has automatic external reference frequency detection or if equipped activate GPS and synchronize the instrument to High Internal accuracy 3 Press the Measurements main menu key 4 Press the RF Measurements submenu key 5 Press the Channel Spectrum submenu key to activate the ...

Page 602: ...e color coded The 3GPP standard requires the adjacent channel power leakage ratio to be better than 45 dB at 5 MHz offset and 50 dB at 10 MHz offset ACLR measurements can be made for multi channel systems by measuring the main channels and the adjacent channels from one to four channels The ACLR screen can display up to 12 channels total In the ACLR measurement mode the filtered channel power is u...

Page 603: ...acent channels Figure 3 3 Note The ACLR measurement uses the filtered channel power to determine the ACLR values and it is listed as filtered on the display In all other screens the unfiltered channel power is displayed as channel power Note Using the Band Spectrum cursor select the required channel and press the ACLR submenu key The measurement will be displayed Figure 3 3 ACLR Measurement ООО Те...

Page 604: ...re selected Spectral Emission Mask Setup The Spectral Emission Mask displays the selected signal and the mask as defined in the 3GPP specification The mask varies depending upon the input signal The instrument also indicates if the signal is within the specified limits by displaying PASSED or FAILED The emission mask is also displayed in a table format with different frequency ranges and whether t...

Page 605: ...using one of the methods listed in the User Guide 2 Press the Measurements main menu key 3 Press the RF Measurements submenu key 4 Press the Spectral Emission Mask submenu key to activate the Spectral Emission Mask measurement Figure 3 5 Figure 3 5 Spectral Emission Mask Measurement ООО Техэнком Контрольно измерительные приборы и оборудование www tehencom com ...

Page 606: ...itter performance measurements in the table format without demodulating the W CDMA HSPA signal The parameters displayed in the RF summary table are Channel Power in dBm and Watts Carrier Frequency Frequency Error Spectral emission Pass Fail criteria Occupied Bandwidth Peak to Average Power ACLR at 10 MHz 5 MHz 5 MHz and 10 MHz channels Figure 3 6 Spectral Emission Mask Summary ООО Техэнком Контрол...

Page 607: ...ay includes spreading factor OVSF codes 256 or 512 with zoom in on codes The instrument can zoom to 32 64 and 128 codes and the user can input the zoom code to start the zoom in from the entered OVSF codes The demodulator also displays CPICH P CCPCH S CCPCH PICH P SCH and S SCH power in the table format For W CDMA HSPA Demodulator the HSPA codes are also displayed Figure 3 7 RF Summary Note The W ...

Page 608: ...the correct S CCPCH code The default S CCPCH code of 3 will be displayed in all the views Set the S CCPCH code to show accurate results 8 Press the PICH Code submenu key to enter the correct PICH code The default PICH code of 16 will be displayed in all the views Set the PICH code to show accurate results 9 Press the Threshold submenu key to manually set the Threshold level which determines which ...

Page 609: ...selected marker 3 Press the On Off submenu key to activate the selected marker 4 Press the Marker Table submenu key to display the Marker table The marker table is displayed on the screen below the CDP measurements table Figure 3 8 CDP Measurement Summary Note Markers can be used to read the individual code power symbol EVM EVM and type of code and can be activated in all the W CDMA HSPA measureme...

Page 610: ...or submenu key to list the Demod menu 2 Press the HSPA submenu key to activate the HSPA measurement The red dot on the submenu key indicates HSPA is selected 3 Press the HSPA submenu key again to display the HSPA measurement signal parameters 4 Press the Total Time submenu key to set the time or the Single Sweep Time submenu key to set the time for the power versus time display The maximum time is...

Page 611: ...y using one of the methods listed in the User Guide 2 Press the Setup main menu key 3 Press the Scrambling Code submenu key to select Auto so that the scrambling code is automatically detected 4 Press the S CCPCH Spread submenu key to manually set the S CCPCH spreading The default S CCPCH spreading factor of 256 will be displayed in all the views Set the S CCPCH spreading factor to show accurate r...

Page 612: ...tween 32 64 and 128 13 Press the Zoom Start submenu key to manually enter the zoom start code 14 Press the Total Time or Single Sweep Time submenu key to set the required time 15 Press the Back submenu key to go back to the Codogram measurement Note The blue color block on the Codogram screen represents the selected zoom codes and the same codes are displayed in the zoom screen Save the data befor...

Page 613: ...ey can display the scrambling codes sorted by Power or Code OTA Procedure 1 Connect the appropriate antenna to the RF In connector to make OTA measurements 2 Set the measurement frequency using one of the methods listed in the User Guide 3 Press the Measurements main menu key 4 Press the OTA submenu key to display the Over The Air submenu 5 Press the Scrambling Code submenu key and select Auto to ...

Page 614: ...CDMA HSPA Signal Analyzer 3 6 Over the Air Measurements 3GPP MG PN 10580 00234 Rev T 3 21 Figure 3 11 OTA Measurement Summary ООО Техэнком Контрольно измерительные приборы и оборудование www tehencom com ...

Page 615: ...d wait for the unit to recognize the external reference and lock to it 6 Press the S CCPCH Spread submenu key to manually set the S CCPCH spreading The default S CCPCH spreading factor of 256 will be displayed in all the views Set the S CCPCH spreading factor to show accurate results 7 Press the S CCPCH Code submenu key to enter the correct S CCPCH code The default S CCPCH code of 3 will be displa...

Page 616: ...de min max threshold Using Master Software Tools a custom test list can be created and downloaded into the instrument All critical parameters can be selected for pass fail testing including each individual code power level the spreading factor and symbol EVM Pass Fail Mode Procedure 1 Connect the appropriate antenna to the RF In connector to make OTA measurements 2 Press the Measurements main menu...

Page 617: ...ry Save Measurement OTA RF Measurements Band Spectrum Channel Spectrum Back ACLR Spectral Emission Mask RF Summary Spectral Emission Summary Back Band Spectrum Ref Level 10 0 dBm Scale 10 dB Band Channel 4357 Previous Band Next Band Back ACLR Display Trace On Off Select of Main Channels Select of Adjacent Channels Channel Width 5 000 MHz Demodulator Setup 1 2 Scrambling Code Auto Manual Max Spread...

Page 618: ...Header Test_Seq_1 Start Test Exit Reset Skip G OTA Setup Scrambling Code Manual Auto Manual Code 1 2 3 4 5 6 On Off Code Lock On Off Display Unit CPICH EC Io Sort By Code Power Code Lock Reset Back H I Over The Air Scrambling Code Multipath Back Multipath Scrambling Code Auto Manual Manual Scrambling Code 351 Vert Display RSCP Rel Pwr Horiz Display Chips uSec Distance m ft Back EMF EMF Measurement...

Page 619: ...annel of the selected standard is automatically tuned Other settings such as channel spacing and integration bandwidth are also automatically entered Appendix A contains a table of the signal standards that are in the instrument firmware Channel Use the Up Down arrow keys the keypad or the rotary knob to select a channel number for the selected signal standard The center of the channel is automati...

Page 620: ... to Units keys dB of External Loss and External Gain as illustrated on the left below the Amplitude menu Enter a value then press the appropriate Units key to make your selection A negative offset value in external gain equates to the same amount of external loss For example entering 1 0 dB in Ext Gain is the same as 1 0 db of Ext Loss Auto Range Press this submenu key to toggle the Auto Range fun...

Page 621: ...read Press the S CCPCH Spread submenu key to enable the S CCPCH spreading factor and enter the desired code The default value is 256 S CCPCH Code Press the S CCPCH Code submenu key to enable and enter the S CCPCH code The default value is 3 PICH Code Press the PICH Code submenu key to activate Paging Indicator Channel and enter the desired code The default value is 16 More Lists the Setup 2 2 Menu...

Page 622: ...e power of the CPICH Freq Err Avg Turns on averaging for the frequency error measurement Freq Err Avg Cnt Sets the number of measurements to use in the frequency error averaging calculations The number can be set from 2 to 15 Sync Type Selects between CPICH or No CPICH for synchronization Back Returns to the Setup 1 2 Menu on page 3 28 Figure 3 19 W CDMA HSPA Setup Menu 2 2 Setup 2 2 Threshold Aut...

Page 623: ...ting including each individual code power spreading factor and symbol EVM The results are displayed in table format with clear identification of pass fail results including min max thresholds and measured results W CDMA Summary Displays the critical W CDMA measurements in a table format Save Measurement Opens a dialog window to name and save the current measurement Refer to the User Guide for addi...

Page 624: ... Leakage Ratio ACLR display The user can set the main channels and adjacent channels from 1 channel to 4 channels This screen can display up to 12 channels total Spectral Emission Mask Displays the received signal and the mask based on received signal strength Spectral Emission Summary Displays the spectral emission mask in table format and whether the received signal passed in each frequency rang...

Page 625: ...annel to analyze the selected channel signal Previous Band Selects the previous band Next Band Selects the next band Back Returns to the RF Measurement Menu on page 3 31 Figure 3 22 W CDMA HSPA Band Spectrum Menu Span Select either a 5 MHz or 10 MHz span Back Returns to the RF Measurement Menu on page 3 31 Figure 3 23 W CDMA HSPA Channel Spectrum Menu Back Band Spectrum Ref Level 10 0 dBm Scale 10...

Page 626: ...hannels Select of Adjacent Channels Set the adjacent channels from 1 channel to 4 channels Channel Width Set the bandwidth for the channels for the number of adjacent channels selected Back Returns to the RF Measurement Menu on page 3 31 Figure 3 24 W CDMA HSPA ACLR Menu Back ACLR Display Trace On Off Select of Main Channels Select of Adjacent Channels Channel Width 5 000 MHz ООО Техэнком Контроль...

Page 627: ...ays the following Code Domain Power CDP parameters in table format Code Status EVM Mod Type Power dB and Power dBm HSPA Open the HSDPA Menu on page 3 36 When HSPA is selected the screen displays all the selected OVSF including high speed data channel codes and selected OVSF with high speed codes in the graphical format The selected code Power versus time and Constellation diagram will be displayed...

Page 628: ... Zoom Start Enter the required zoom start code For example to start at code 2 enter 2 Control Channels Select a control channel mode between Rel Abs and Delta Back Returns to the Demodulator Menu on page 3 34 Figure 3 26 W CDMA HSPA CDP Menu CDP Zoom 32 64 128 Zoom Start 0 Control Channels Rel Abs Delta Back ООО Техэнком Контрольно измерительные приборы и оборудование www tehencom com ...

Page 629: ...the next active code to the right of the selected code Total Time Set the time for the power versus time screen The maximum total time is 72 hours Single Sweep Time Set the single sweep time The instrument automatically calculates the total time IQ Persistence Set the number of samples before displaying the screen maximum 48 Control Channels Select a control channel mode between Rel Abs and Delta ...

Page 630: ...s or the rotary knob to enter the total time to display the changes in code power levels The maximum total time for Codogram is 72 hours Single Sweep Time Single sweep time is related to total time Use the keypad arrow keys or the rotary knob to set the single sweep time Back Returns to the Demodulator Menu on page 3 34 Figure 3 28 W CDMA HSPA Codogram Menu Codogram Zoom 32 64 128 Zoom Start 0 Tot...

Page 631: ...h Menu on page 3 40 EMF Option 444 only When first selected this submenu key enables the EMF Measurement mode Once the EMF Measurement mode is active this key opens the W CDMA EMF Menu on page 8 10 Back Returns to the Measurements Menu on page 3 30 Figure 3 29 W CDMA HSPA Over The Air Menu Over The Air Scrambling Code Multipath Back EMF ООО Техэнком Контрольно измерительные приборы и оборудование ...

Page 632: ...ode Lock Lock the measured codes Display Unit Display the codes by CPICH or Ec Io Sort By Sort the measured codes by code numbers or power Code Lock Reset Reset the measurement screen Back Returns to the Over The Air Menu on page 3 38 Figure 3 30 W CDMA HSPA Over The Air OTA Setup Menu OTA Setup Scrambling Code Manual Auto Manual Code 1 2 3 4 5 6 On Off Code Lock On Off Display Unit CPICH EC Io So...

Page 633: ...ets the manual scrambling code Vert Display Switch vertical display between RSCP and Rel Pwr Horiz Display Switch between Chips and uSec for the horizontal display Distance Switch between meters and feet Back Returns to the Over The Air Menu on page 3 38 Figure 3 31 W CDMA HSPA Multipath Menu Multipath Scrambling Code Auto Manual Manual Scrambling Code 351 Vert Display RSCP Rel Pwr Horiz Display C...

Page 634: ... in Master Software Tools from the window The ScripMaster instructions are loaded into the instrument and the ScriptMaster menu is listed Start Test Begins the running the instructions listed in ScriptMaster Change File Header Opens the Pass Fail Test File Header entry window and lists the Text Entry menu to name the saved file after the ScriptMaster measurement process is complete Skip Skips over...

Page 635: ...w The table is automatically sized to display all markers that are turned on In addition to the marker frequency and amplitude the table also shows delta frequencies and amplitude deltas for all markers that have deltas entered for them All Markers Off Turns off all markers Figure 3 34 W CDMA HSPA Marker Menu Sweep Single Continuous This submenu key toggles between continuous sweep and single swee...

Page 636: ...HSPA measurement mode 3 16 Trace Menu This menu is not available in W CDMA HSPA measurement mode 3 17 Limit Menu This menu is not available in W CDMA HSPA measurement mode 3 18 Other Menus Preset File Mode and System are described in the instrument User Guide ООО Техэнком Контрольно измерительные приборы и оборудование www tehencom com ...

Page 637: ...3 15 Measure Menu W CDMA HSPA Signal Analyzer 3 44 PN 10580 00234 Rev T 3GPP MG ООО Техэнком Контрольно измерительные приборы и оборудование www tehencom com ...

Page 638: ... mode set up frequency and amplitude and perform file management 4 3 TD SCDMA HSPA RF Measurements The following parameters are measured in the RF Measurement mode Channel Power Channel power measures the average time domain power within the 1 6 MHz channel bandwidth and is expressed in dBm Channel Power RRC Channel Power RRC is similar to Channel Power but is measured after being filtered by usin...

Page 639: ... The channel power of the 1 6 MHz channel left of the main channel This is useful in the multi carrier environments Right Channel Power The channel power of the 1 6 MHz channel right of the main channel This is useful in the multi carrier environments Left Channel Occ BW This is the occupied bandwidth of the channel left of the main channel and is useful in a multi carrier environment This value i...

Page 640: ...K 16QAM or 64QAM d If the channel in use has a known DwPTS signal select On If the channel in use does not have a DwPTS signal select Off If the presence of the DwPTS is unknown select Auto e If necessary press the Tau Offset submenu key to specify a Tau Offset value The maximum value is 5 sec f Press the Back submenu key to return to the Setup menu 3 Press the Measurements main menu key 4 Press t...

Page 641: ... Auto QPSK 8PSK 16QAM or 64QAM g If the channel in use has a known DwPTS signal select On If the channel in use does not have a DwPTS signal select Off If the presence of the DwPTS is unknown select Auto h If necessary press the Tau Offset submenu key to specify a Tau Offset value The maximum value is 5 sec i Press the Back submenu key to return to the Setup menu j Press the Uplink Switch Point su...

Page 642: ...easurement Setups 3GPP MG PN 10580 00234 Rev T 4 5 Figure 4 2 TD SCDMA HSPA Power vs Time Sub Frame Measurement Figure 4 3 TD SCDMA HSPA Power vs Time Slot Measurement ООО Техэнком Контрольно измерительные приборы и оборудование www tehencom com ...

Page 643: ... 1 Press the Trigger Type submenu key to toggle through the three trigger types No Trig GPS and Ext The active state is underlined on the face of the submenu key 2 Press the Ext Trigger Polarity submenu key to select either Rising or Falling trigger edge 3 Press the Back submenu key to return to the Setup menu c Press the Uplink Switch Point submenu key The numerical value on the face of the subme...

Page 644: ...oise Floor Noise floor is the average of inactive codes powers dB from the code domain power CDP Freq Error Frequency error is the difference between the received center frequency and the specified center frequency This value is linked to the external frequency reference accuracy and is typically useful only with a good external frequency reference or GPS reference Tau Tau is the timing delay of t...

Page 645: ...en In the list window use the rotary knob or press the touch screen to highlight Auto or the desired slot 0 to 6 then press the Enter key b Press the Trigger submenu key The Trigger menu opens 1 Press the Trigger Type submenu key to toggle through the three trigger types No Trig GPS and Ext The active state is underlined on the face of the submenu key 2 Press the Ext Trigger Polarity submenu key t...

Page 646: ...nu 6 Press the Back submenu key again to return to the Measurements menu Modulation Summary The Modulation Summary displays the critical Modulation transmitter performance measurements in a table format by demodulating the TD SCDMA HSPA signal that is displayed in the Modulation Summary table Slot Power EVM Peak EVM Freq Error Freq Error PPM Tau Noise Floor Carrier Feed Through and Peak CDE 1 Pres...

Page 647: ... easy reference Tau Scan Displays the code power versus Tau in a bar graph format The horizontal axis Tau has dynamic scale The six strongest SYNC DL codes are displayed below the bar graph with their Tau us and Ec Io dB values DwPTS Power and Pilot Dominance values are displayed below the table of the six strongest codes see Figure 4 6 DwPTS Pwr The power in the Downlink Pilot slot excluding the ...

Page 648: ...r Rising or Falling trigger edge c If necessary press the Tau Offset submenu key to specify a Tau Offset value The maximum offset value is 5 sec d Press the Back submenu key to return to the Setup menu 2 Continue with the following setups for the specific OTA measurements Code Scan 1 Press the Measurements main menu key 2 Press the OTA submenu key The Over the Air menu is displayed 3 Press the Cod...

Page 649: ...l submenu key to activate the test 3 Press the Pass Fail submenu key again to display the Pass Fail menu 4 Press the Select Pass Fail Test submenu key Use the arrow keys or the rotary knob to highlight the desired test mode then press the Select Test submenu key or the Enter key 5 Press the Reset submenu key to begin a new pass fail test measurement see Figure 4 7 6 Press the Back submenu key to r...

Page 650: ...t Channel Increment Channel Setup Slot Selection Trigger Uplink Switch Point 3 SYNC DL Code Scrambling Midamble Code Max Users Meas Speed Fast Norm Slow More Back Trigger Trigger Type No Trig GPS Ext Ext Trigger Polarity Rising Falling Cancel Slot Selection Auto Cancel SYNC DL Code Auto Tau Offset 0 ms Measurements RF Measurements Pass Fail Mode TD SCDMA Summary Save Measurement OTA Demodulator Q ...

Page 651: ...P Data Modulation Summary CDP Table Back CDP Data CDP Units Relative Absolute Back Back Record Off On Run Hold Hold Run Pass Fail Mode Select Pass Fail Test Back Reset Q R S Over The Air Code Scan Tau Scan Back Advanced Settings Number of Carriers 1 3 Tau Offset 0 ms Spreading Factor Auto 16 1 Modulation Type Auto DwPTS Auto On Off Cancel Slot Selection Auto P O Back Mask Off On CDP Marker Off On ...

Page 652: ...ect as pressing the MHz submenu key Signal Standard Opens the Signal Standards list box in order to select signal standard Channel Opens the Channel Editor list box in order to select a channel number within the range of the selected signal standard Set CF to Closet Channel Moves the center frequency to the closest frequency that matches a channel number in the current signal standard Decrement Ch...

Page 653: ...enu keys will change to Units keys dB of External Loss and External Gain as illustrated on the left below the Amplitude menu Enter a value then press the appropriate Units key to make your selection A negative offset value in external gain equates to the same amount of external loss For example entering 1 0 dB in Ext Gain is the same as 1 0 db of Ext Loss Auto Range Press this submenu key to toggl...

Page 654: ...he rotary knob or press the touch screen to highlight the desired code 0 through 31 then press Enter If Auto is selected the active SYNC DL code is applied Scrambling Midamble Code Press this submenu key to display the Scrambling Code Menu on page 4 19 and open the Scrambling Midamble Code selection window Use the rotary knob or press the touch screen to highlight the desired code 0 through 127 th...

Page 655: ...enu Trigger Type Select a trigger type by pressing this submenu key to toggle among No Trig GPS or Ext The active state is underlined on the face of the submenu key Ext Trigger Polarity Press this submenu key to toggle either Rising or Falling polarity of external trigger Tau Offset Press this submenu key to add an offset 5 sec is the maximum offset that can be entered to the current Tau value Bac...

Page 656: ...g Midamble code Auto in the Scrambling Midamble Code selection window and the Auto submenu key have the same function The Auto submenu key provides a one touch method of selecting the Auto setting Cancel Disregards any entry and returns to Setup Menu on page 4 17 Figure 4 16 TD SCDMA HSPA Scrambling Midamble Code Menu Auto Automatically looks for the maximum number of users Auto in the Maximum Use...

Page 657: ...use has a known DwPTS signal select On If the channel in use does not have a DwPTS signal then select Off If the presence of the DwPTS is unknown select Auto Tau Offset Press this submenu key to add an offset to the current Tau value Use the rotary knob or the arrow keys to change the value You can also enter a value using the numeric keypad in which case you need to press the appropriate Units ke...

Page 658: ...Mode Menu on page 4 26 and set up pass fail testing TD SCDMA Summary Press this submenu key to display a table of the TD SCDMA measurements The following measurement values are displayed in the table Channel Power Occ BW Slot Power DwPTS Power UpPTS Power On Off Ratio Freq Error Freq Error PPM EVM Peak CDE Tau Save Measurement Press this submenu key to save a measurement You may accept the default...

Page 659: ...g on unit selection Power vs Time Opens the Power vs Time Menu on page 4 23 Spectrum Emission Changes the display for Spectrum Emission measurement RF Summary Press this submenu key to display the following RF measurements in table format Channel Power Channel Power RRC Occ BW DwPTS Pwr UpPTS Pwr On Off Ratio Slot PAR Left Channel Power Right Channel Power Left Channel Occ BW Right Channel Occ BW ...

Page 660: ...ed the active slot will be detected automatically Auto Automatically looks for an active downlink slot Auto in the Slot Selection window and the Auto submenu key have the same function Cancel Cancels any new setting you have highlighted without pressing Enter If the Slot Selection currently in effect is highlighted returns to the Power vs Time menu Mask Press this submenu key to turn the mask On a...

Page 661: ... this submenu key to display a table of the CDP Code Mod Type Power dB and Power dBm Modulation Summary Press this submenu key to view the performance of the transmitter demodulated TD SCDMA HSPA signal in table format The following parameters are displayed in the table Slot Power dBm EVM Peak EVM Freq Error Freq Error PPM Tau Noise Floor Carrier Feed Through Peak CDE Back Press this submenu key t...

Page 662: ...This is the file in which all recorded data is stored Selecting Off stops all recording and closes the log file When pressed again recording begins in a new file If Record is turned On when the measurement is a non OTA measurement such as Spectrum then no action is performed Run Hold Press this submenu key to set either Run mode or Hold mode Hold mode prevents the instrument from taking any new me...

Page 663: ...the desired test PASS_FAIL_RF PASS_FAIL_DEMOD or PASS_FAIL_ALL then press the Select Test submenu key Press Esc to return to the Pass Fail Mode menu without initiating a test Reset Press this submenu key to restart the measurement or to begin a new pass fail test measurement Back Press this submenu key to return to the Measurements Menu on page 4 21 Figure 4 25 TD SCDMA HSPA Pass Fail Mode Menu Pa...

Page 664: ... User Guide Sweep Hold Run Press this submenu key to toggle between Run mode and Hold mode Hold mode prevents the instrument from taking any new measurements and freezes the current measurement Run mode allows the instrument to continually take measurements Trigger Sweep Pressing this submenu key causes the instrument to make a single sweep when the instrument is in single sweep mode This key has ...

Page 665: ...4 13 Measure Menu TD SCDMA HSPA Signal Analyzer 4 28 PN 10580 00234 Rev T 3GPP MG ООО Техэнком Контрольно измерительные приборы и оборудование www tehencom com ...

Page 666: ...owing LTE specific setup procedures 1 Press the Setup main menu key 2 Press the BW submenu key to open the Select Bandwidth list Select the desired Bandwidth with the arrow keys or rotary knob and press Enter 3 Press the EVM Mode submenu key to select either Auto or PBCH Only Selecting Auto measures Physical Downlink Shared Channel PDSCH if data is available otherwise it measures Physical Broadcas...

Page 667: ...the base station The Cell ID field is automatically populated with the last measured Cell ID for user convenience 5 Press Back to return to the Setup main menu Antenna Status The Antenna Status indicator can show when antennas are detected and which one is currently being measured Antenna Status is displayed for any EVM measurement shown Constellation Control Channel Power Modulation Summary and L...

Page 668: ...ls on each side as a bar graph For example when BW is set to 10 MHz the channel spacing is 20 MHz 10 MHz 10 MHz and 20 MHz and the channels are color coded Spectral Emission Mask The Spectral Emission Mask SEM measurement supports the testing for Operating Band Unwanted Emissions described in the 3GPP TS 36 141 Base Station Conformance testing document There is support for Category A and Category ...

Page 669: ...ubmenu key 3 Press the Channel Spectrum submenu key to activate this RF measurement view Figure 5 2 4 Press the Channel Spectrum submenu key again to select the Channel Spectrum menu where you can adjust the span 5 Press the Back submenu key to return to the RF menu Figure 5 2 Channel Spectrum ООО Техэнком Контрольно измерительные приборы и оборудование www tehencom com ...

Page 670: ...s main menu key 2 Press the RF submenu key 3 Press the ACLR submenu key to activate ACLR display and measurement Figure 5 3 4 Press the Back submenu key to return to the Measurements menu Figure 5 3 Adjacent Channel Leakage Ratio ООО Техэнком Контрольно измерительные приборы и оборудование www tehencom com ...

Page 671: ...y Figure 5 4 4 Press the Spectral Emission Mask submenu key again to list the Spectral Emission menu and set up its parameters Refer to Figure 5 24 LTE RF Menu on page 5 32 for additional information 5 To view the measurement data in a table format press the Summary Table submenu key so On is underlined 6 Press the Back submenu key to return to the RF menu Figure 5 4 Spectral Emission Mask ООО Тех...

Page 672: ...s main menu key 2 Press the RF submenu key 3 Press the RF Summary submenu key to activate and display the RF measurements in table format Figure 5 5 4 Press the Back submenu key to return to the Measurements menu Figure 5 5 RF Summary ООО Техэнком Контрольно измерительные приборы и оборудование www tehencom com ...

Page 673: ...menus Setting these values can be done by entering them manually or by pressing Autoscale Color Map Measurements Table Active RBs The number of active Resource Blocks A RB is determined to be active if the measured PDSCH power is above a certain threshold that indicates that the RB is being used for carrying data Utilization The percentage of RBs that carry data It is the number of Active RBs divi...

Page 674: ...he second number is the current measured value Reset occurs when setup parameters are changed or by toggling the EVM Max Hold button Freq Error The difference between the measured carrier frequency and the specified carrier frequency is the frequency error This number is only as accurate as the frequency reference that is used and is typically only useful with a good external frequency reference o...

Page 675: ... search PBCH Power Physical Broadcast Channel Power This physical channel carries system information for user equipment UE requiring access to the network PCFICH Power Physical Control Format Indicator Channel Power This channel provides information to enable the UE to decode the PDCCH and PDSCH channels PHICH Power Physical Hybrid Automatic Repeat Request Indicator Channel Transmits the channel c...

Page 676: ...y to return to the Modulation menu Markers 1 While in the Power vs Resource Block measurement press the Marker main menu key The RB Marker submenu opens The Marker State button default value is On so the markers highlight a row of sub frames and a column of sub carriers 2 To immediately find the strongest resource block press the Peak Search button 3 To choose a specific resource block press the M...

Page 677: ...Press the Constellation submenu key again to list the Constellation menu and set up the reference points and data legend a Press the Reference Points submenu key to turn the reference points small white circles On or Off b Press the Data Legend submenu key to turn the data legend On or Off 4 Press the Back submenu key to return to the Modulation menu Figure 5 7 Constellation Measurement View ООО Т...

Page 678: ...bmenu key 3 Press the Control Channel Power submenu key to activate the Control Channel Power display Figure 5 8 Press the key again to view or change the Display Mode and Control Channel EVM settings 4 Press the Back submenu key to return to the Modulation menu Figure 5 8 Control Channel Power ООО Техэнком Контрольно измерительные приборы и оборудование www tehencom com ...

Page 679: ...ain menu key 2 Press the Modulation submenu key 3 Press the Tx Time Alignment submenu key to set the modulation measurement to Tx Time Alignment view Figure 5 9 4 Press the Back submenu key to return to the Measurements menu Figure 5 9 Tx Time Alignment ООО Техэнком Контрольно измерительные приборы и оборудование www tehencom com ...

Page 680: ...enu key 2 Press the Modulation submenu key 3 Press the Modulation Summary submenu key to activate and display the modulation measurements in table format Figure 5 10 4 Press the Back submenu key to return to the Measurements menu Figure 5 10 Modulation Summary ООО Техэнком Контрольно измерительные приборы и оборудование www tehencom com ...

Page 681: ... Cell ID Sector ID Group ID Identifying information sent by the transmitter in the sync signal S SS Power Secondary Sync Signal power is displayed in dBm or Watts The secondary sync signal is used to obtain frame synchronization and cell identity S SS Power contains information needed for cell search RSRP Reference Signal Received Power provides the UE with essential information about the strength...

Page 682: ...verage Mapping Carrier Aggregation This measurement displays a table of up to five Component Carriers CC used in Carrier Aggregation and their measured signal components Frequency This is the set center frequency Bandwidth BW This is the set bandwidth of the Component Carrier Cyclic Prefix CP The length of Cyclic Prefix can be specified as either Normal or Extended MIMO The MIMO status indicators ...

Page 683: ...talled The option requires an isotropic antenna at a frequency range that is within specification of the instrument used Refer to the isotropic antenna and spectrum analyzer Technical Data Sheets Chapter 8 EMF Option 444 provides connection instructions for the antenna and detailed descriptions of the EMF Measurement menu and submenus Measurement Setup Scanner 1 Press the Measurements main menu ke...

Page 684: ...e Tx Test submenu key to activate the OTA Tx Test display Figure 5 12 on page 5 20 Press the Tx Test key again to display the OTA Tx Test menu 4 Press the Show Mod Results key to display or hide the PBCH Modulation Results Strongest SS table 5 Press Back to return to the Over the Air menu Figure 5 11 Over the Air Scanner Measurements Note When Show Mod Results is on the Tx Test measurement speed i...

Page 685: ...Mapping Refer to Chapter 7 LTE and TD LTE Coverage Mapping Carrier Aggregation Refer to Carrier Aggregation Menu on page 5 41 EMF Refer to LTE TD LTE EMF Menu on page 8 2 Figure 5 12 Over the Air Tx Test Measurement ООО Техэнком Контрольно измерительные приборы и оборудование www tehencom com ...

Page 686: ...l Test submenu key to open the Select Pass Fail Test window Highlight the desired test with the arrow keys or rotary knob and press Enter to start the test Refer to the instrument User Guide and the Master Software Tools MST User Guide for creating new Pass Fail tests b Press the Reset submenu key to erase a previous measurement s and restart the Pass Fail test 3 Press the Back submenu key to retu...

Page 687: ... measures the average power within the selected bandwidth and is expressed in dBm or Watts Ref Signal RS Power Reference Signal power displayed in dBm or Watts The reference signal is used for downlink channel estimation Sync Signal SS Power Sync signal power displayed in dBm or Watts EVM rms The RMS of all the error vectors between the reconstructed ideal signals and the received signals divided ...

Page 688: ... T 5 23 Measurement Setup 1 Press the Measurements main menu key 2 Press the LTE Summary submenu key to activate and display the LTE measurements in table format Figure 5 14 LTE Summary ООО Техэнком Контрольно измерительные приборы и оборудование www tehencom com ...

Page 689: ...etup BW 10 MHz EVM Mode Auto PBCH Only RF Back V W X Y V U Freq Err Avg Cnt 1 Back Channel Spectrum Span 10 MHz Category A B Opt 1 Summary Table Off On Spectral Emission Back Sync Marker Marker Select M1 M2 Marker State Off On Delta Marker Edit Reference Delta Peak Search Markers Off Marker Peak Search Marker Sub frame 0 Marker RB 0 U Back Sync Sync Type Normal SS RS Cell ID 0 Channel Step Size 1 ...

Page 690: ...how Mod Results On Off Control Channel EVM On Off Show Mod Results On Off OTA Scanner Bar Graph OTA Tx Test Back Tx Test Bar Graph SS Power Mapping Control Channel Power Ng 1 6 Tx Time Alignment Back SINR RSRQ RSRP SS Power Back Back Control Channels Display Mode Bar Graph Table Refer to Chapter 7 Save Recall Points Map Measurement Setup Point Distance Time Setup Coverage Mapping Back Start Data C...

Page 691: ...ontinued Figure 5 17 LTE Menu Layout 3 of 3 Carrier Aggregation Z CC1 CC2 CC3 Center Freq 1 000 GHz Channel Set CF To Closest Channel CC1 Back Back CC5 CC4 TAE Off On CC1 Off On Signal Standard BW 10 MHz ООО Техэнком Контрольно измерительные приборы и оборудование www tehencom com ...

Page 692: ...number within the range of the selected signal standard Set CF to Closest Channel Moves the center frequency to the closest frequency that matches a channel number in the current signal standard Decrement Channel Decrements the channel by one channel Increment Channel Increments the channel by one channel Channel Step Size Use this submenu key to specify the step size used for incrementing or decr...

Page 693: ...standard will be marked as favorites in the Fav column Top of List Press this submenu key to display the first signal standard in the list Page Up Press this submenu key to scroll up one page in the signal standard list Page Down Press this submenu key to scroll down one page in the signal standard list Bottom of List Press this submenu key to display the last signal standard in the list Press Esc...

Page 694: ... below the Amplitude menu Enter a value then press the appropriate Units key to make your selection A negative offset value in external gain equates to the same amount of external loss For example entering 1 0 dB in Ext Gain is the same as 1 0 db of Ext Loss Auto Range Press this submenu key to toggle the Auto Range function between On and Off When set to On the instrument adjusts the reference le...

Page 695: ...se between the Normal SS or RS Sync Type Only choose RS when there is no sync signal present in the transmitter under test If RS is chosen and a sync signal is present no modulation measurements will be available Cell ID Identifying information sent by the transmitter in the sync signal If Normal SS is selected as the Sync Type the Cell ID is extracted automatically from the Sync Signal The Cell I...

Page 696: ...l testing LTE Summary Press this submenu key to display a table of the LTE measurements The following measurement values are displayed in the table Freq Error Occupied BW Carrier Frequency Channel Power Ref Signal RS Power Sync Signal SS Power EVM rms PBCH Power PCFICH Power Spectral Emission Mask Save Measurement Press this submenu key to save a measurement You may accept the default filename or ...

Page 697: ...cally selected based on the current carrier frequency channel and BW values The instrument indicates if the signal is within the specified limits by displaying PASS or FAIL The emission mask information is also displayed in a table format with different frequency ranges and whether the signal PASSED FAILED in that region Press this button again to list the Spectral Emission submenu Category A B Op...

Page 698: ...Control Channel Power Press the Control Channel Power submenu key to set the display as bar graph or table Tx Time Alignment Press to set the modulation measurement to Tx Time Alignment view Refer to Tx Time Alignment on page 5 14 Modulation Summary Press this submenu key to display a summary table of all of the modulation related numerical measurement results Ref Signal RS Power Sync Signal SS Po...

Page 699: ...he color map RB Color Map Max Value Press to adjust the RB Color Map Max Value manually RB Color Map Range Press to adjust the RB Color Range manually Back Press this submenu key to return to the Modulation Menu on page 5 33 Figure 5 26 LTE Power vs Resource Block Menu Back Power vs RB Autoscale Color Map RB Color Map Max Value 0 0 dBm RB Color Map Range 100 dB ООО Техэнком Контрольно измерительны...

Page 700: ...n and Off On is the default state Back Press this submenu key to return to the Modulation Menu on page 5 33 The constellations are color coded as follows QPSK is shown in purple 16 QAM is shown in green 64 QAM is shown in yellow Values for the following measurements are shown beneath the graph Ref Signal RS Power EVM rms Freq Error Carrier Frequency Sync Signal SS Power EVM pk Freq Error ppm Cell ...

Page 701: ... column is included to display the EVM of each control channel The EVM column is included for either Bar Graph or Table displays Ng 1 6 Determines the number of PHICH groups in a LTE sub frame Back Press this submenu key to return to the Modulation Menu on page 5 33 Figure 5 28 LTE Control Channel Menu Control Channels Display Mode Bar Graph Table Control Channel EVM On Off Ng 1 6 Back ООО Техэнко...

Page 702: ...mapping parameters Save Recall Points Map Measurement Setup and Point Distance Time Setup For full details refer to Chapter 7 LTE and TD LTE Coverage Mapping Carrier Aggregation Press this submenu key to display the Carrier Aggregation Component Carrier frequencies and measured parameters In the Carrier Aggregation Menu select the desired Component Carrier to set up for measurement Refer to Carrie...

Page 703: ...urement records The instrument logs a data record at the end of each measurement cycle A maximum of 10 000 records can be stored in a file When a file is full a new file is automatically created Files are automatically saved to the instrument s Current Location selection in the subdirectory Internal Memory user Refer to the File Management chapter in your instrument User Guide for instructions on ...

Page 704: ...the PBCH Results table and Antenna Status indicators are not displayed When set to On the Antenna Status and PBCH Modulation Results table are displayed Back Press this submenu key to return to Over the Air Menu on page 5 37 Figure 5 31 LTE Over the Air Tx Test Menu Back Show Mod Results On Off OTA Tx Test ООО Техэнком Контрольно измерительные приборы и оборудование www tehencom com ...

Page 705: ...5 Back Returns to the Over the Air Menu on page 5 37 Start Stop Data Collection Press this main menu key to start coverage mapping data collection based on Measurement Setup settings and Point Distance Time Setup settings A running count of collected data points is displayed at the bottom of the screen Press again to stop data collection Figure 5 32 Coverage Mapping Menu Save Recall Points Map Mea...

Page 706: ...ts the frequency is automatically set to the currently selected Component Carrier if it is on TAE Time Alignment Error TAE is a measurement of the differential transmission delay between the Component Carriers The 3GPP specification identifies the limits of the delays for the system to operate properly Back Returns to the Over the Air Menu on page 5 37 Figure 5 33 Carrier Aggregation Menu Carrier ...

Page 707: ...lue then press the desired unit submenu key or press Enter to select MHz as the frequency unit Signal Standard Opens the Standard List Menu on page 5 28 Channel Opens the Channel Editor dialog where you can select a channel number within the range of the selected signal standard Set CF to Closest Channel Moves the center frequency to the closest frequency that matches a channel number in the curre...

Page 708: ... the arrow keys or rotary knob and press Enter to start the test or press Esc to cancel your choice Note The current list of pass fail tests is a default list Master Software Tools MST includes features to create additional pass fail tests Reset Press this submenu key to restart the measurement or to begin a new pass fail test measurement Back Press this submenu key to return to Measurements Menu ...

Page 709: ...other marker Marker State Sets the state of the selected marker underlined in the Marker Select submenu Marker Edit Displays when the Market State submenu is set to Delta Toggles between activating the Reference or Delta marker Peak Search Moves the selected marker to the trace peak Markers Off Turns off all markers Back Press this submenu key to return to Measurements Menu on page 5 31 Figure 5 3...

Page 710: ...een activating the Reference or Delta marker Peak Search Moves the selected marker to the trace peak Markers Off Turns off all markers Back Press this submenu key to return to Measurements Menu on page 5 31 Figure 5 37 LTE Resource Block Marker Menu Sweep Single Continuous This submenu key toggles between continuous sweep and single sweep In single sweep mode the results of a sweep are displayed o...

Page 711: ...nu This menu is not available in LTE measurement mode 5 18 Limit Menu This menu is not available in LTE measurement mode 5 19 Other Menus Preset File Mode and System are described in the instrument User Guide ООО Техэнком Контрольно измерительные приборы и оборудование www tehencom com ...

Page 712: ...3 Press the EVM Max Hold submenu key On to display both the Maximum EVM value since Reset and the current measured value This applies to EVM RMS and Peak values Selecting Off displays only the current measured value 4 Press the EVM Mode submenu key to select either Auto or PBCH Only Selecting Auto measures Physical Downlink Shared Channel PDSCH if data is available otherwise it measures Physical B...

Page 713: ...wer measures the average power within the selected bandwidth and is expressed in dBm or Watts Occupied BW The measured occupied bandwidth is calculated as the bandwidth containing 99 of the total integrated power within the selected span around the selected center frequency Power vs Time Power vs Time displays the power of the received signal in the time domain A submenu allows the user to toggle ...

Page 714: ...e channels are color coded Spectral Emission Mask The Spectral Emission Mask SEM measurement supports the testing for Operating Band Unwanted Emissions described in the 3GPP TS 36 141 Base Station Conformance testing document There is support for Category A and Category B Option 1 only masks which are automatically selected based on the current carrier frequency channel and BW values The instrumen...

Page 715: ...F submenu key 3 Press the Channel Spectrum submenu key to activate this RF measurement view Figure 6 2 4 Press the Channel Spectrum submenu key again to select the Channel Spectrum menu where you can adjust the span 5 Press the Back submenu key to return to the RF menu Figure 6 2 Channel Spectrum ООО Техэнком Контрольно измерительные приборы и оборудование www tehencom com ...

Page 716: ... 2 Press the RF submenu key 3 Press the Power vs Time submenu key to select measurement 4 Press the Power vs Time submenu key again to set the View and Sub Frame Number parameters 5 Press the Back submenu key to return to the RF menu Figure 6 3 Power vs Time ООО Техэнком Контрольно измерительные приборы и оборудование www tehencom com ...

Page 717: ...ents main menu key 2 Press the RF submenu key 3 Press the ACLR submenu key to activate ACLR display and measurement Figure 6 4 4 Press the Back submenu key to return to the Measurements menu Figure 6 4 Adjacent Channel Leakage Ratio ООО Техэнком Контрольно измерительные приборы и оборудование www tehencom com ...

Page 718: ...Spectral Emission measurement and display Figure 6 5 4 Press the Spectral Emission Mask submenu key again to list the Spectral Emission menu and set up its parameters 5 To view the measurement data in a table format press the Summary Table submenu key so On is underlined 6 Press the Back submenu key to return to the RF menu Figure 6 5 Spectral Emission Mask ООО Техэнком Контрольно измерительные пр...

Page 719: ...ents main menu key 2 Press the RF submenu key 3 Press the RF Summary submenu key to activate and display the RF measurements in table format Figure 6 6 4 Press the Back submenu key to return to the Measurements menu Figure 6 6 RF Summary ООО Техэнком Контрольно измерительные приборы и оборудование www tehencom com ...

Page 720: ... pressing Autoscale Color Map Measurements Table Active RBs The number of active Resource Blocks in sub frame 0 An RB is determined to be active if the measured PDSCH power is above a certain threshold that indicates that the RB is being used for carrying data Utilization The percentage of Resource Blocks that carry data It is the number of Active Resource Blocks in sub frame 0 divided by the tota...

Page 721: ... current measured value Reset occurs when setup parameters are changed or by toggling the EVM Max Hold button Freq Error The difference between the measured carrier frequency and the specified carrier frequency is the frequency error This number is only as accurate as the frequency reference that is used and is typically only useful with a good external frequency reference or GPS Carrier Frequency...

Page 722: ...rch PBCH Power Physical Broadcast Channel Power This physical channel carries system information for user equipment UE requiring access to the network PCFICH Power Physical Control Format Indicator Channel Power This channel provides information to enable the UE to decode the PDCCH and PDSCH channels PHICH Power Physical Hybrid Automatic Repeat Request Indicator Channel Transmits the channel coded...

Page 723: ... return to the Modulation menu Markers 1 While in the Power vs Resource Block measurement press the Marker main menu key The RB Marker submenu opens The Marker State button default value is On so the markers highlight a row of sub frames and a column of sub carriers 2 To immediately find the strongest subcarrier within the sub frame press the Peak Search button 3 To choose a specific RB press the ...

Page 724: ... 8 Press the Constellation submenu key again to list the Constellation menu and set up the reference points and data legend a Press the Reference Points submenu key to turn the reference points small white circles On or Off b Press the Data Legend submenu key to turn the data legend On or Off 4 Press the Back submenu key to return to the Modulation menu Figure 6 8 Constellation Measurement View ОО...

Page 725: ... key 3 Press the Control Channel Power submenu key to activate the Control Channel Power display in table format Figure 6 9 Press the key again to view or change the Display Mode and Control Channel EVM settings 4 Press the Back submenu key to return to the Modulation menu Figure 6 9 Control Channel Power ООО Техэнком Контрольно измерительные приборы и оборудование www tehencom com ...

Page 726: ... main menu key 2 Press the Modulation submenu key 3 Press the Tx Time Alignment submenu key to set the modulation measurement to Tx Time Alignment view Figure 6 10 4 Press the Back submenu key to return to the Measurements menu Figure 6 10 Tx Time Alignment ООО Техэнком Контрольно измерительные приборы и оборудование www tehencom com ...

Page 727: ...n menu key 2 Press the Modulation submenu key 3 Press the Modulation Summary submenu key to activate and display the modulation measurements in table format Figure 6 11 4 Press the Back submenu key to return to the Measurements menu Figure 6 11 Modulation Summary ООО Техэнком Контрольно измерительные приборы и оборудование www tehencom com ...

Page 728: ...ing measurements Cell ID Sector ID Group ID Identifying information sent by the transmitter in the sync signal S SS Power Secondary Sync Signal power is displayed in dBm or Watts The secondary sync signal is used to obtain frame synchronization and cell identity S SS Power contains information needed for cell search RSRP Reference Signal Received Power Provides the UE with essential information ab...

Page 729: ... Coverage Mapping Carrier Aggregation This measurement displays a table of up to five Component Carriers CC used in Carrier Aggregation and their measured signal components Frequency This is the set center frequency Bandwidth BW This is the set bandwidth of the Component Carrier Cyclic Prefix CP The length of Cyclic Prefix can be specified as either Normal or Extended MIMO The MIMO status indicato...

Page 730: ...alled The option requires an isotropic antenna at a frequency range that is within specification of the instrument used Refer to the isotropic antenna and spectrum analyzer Technical Data Sheets Chapter 8 EMF Option 444 provides connection instructions for the antenna and detailed descriptions of the EMF Measurement menu and submenus Measurement Setup Scanner 1 Press the Measurements main menu key...

Page 731: ...key 3 Press the Tx Test submenu key to activate the OTA Tx Test display Figure 6 13 on page 6 21 Press the Tx Test key again to display the OTA Tx Test menu 4 Press the Show Mod Results key to display or hide the PBCH Modulation Results Strongest SS table 5 Press Back to return to the Over the Air menu Figure 6 12 Over the Air Measurements Note When Show Mod Results is on the Tx Test measurement s...

Page 732: ...21 Mapping Refer to Chapter 7 LTE and TD LTE Coverage Mapping Carrier Aggregation Refer to Carrier Aggregation Menu on page 6 45 EMF Refer to LTE TD LTE EMF Menu on page 8 2 Figure 6 13 Over the Air Tx Test Measurement ООО Техэнком Контрольно измерительные приборы и оборудование www tehencom com ...

Page 733: ...ail Test submenu key to open the Select Pass Fail Test window Highlight the desired test with the arrow keys or rotary knob and press Enter to start the test Refer to the instrument User Guide and the Master Software Tools MST User Guide for creating new Pass Fail tests b Press the Reset submenu key to erase a previous measurement s and restart the Pass Fail test 3 Press the Back submenu key to re...

Page 734: ...nnel power measures the average power within the selected bandwidth and is expressed in dBm Ref Signal RS Power Reference Signal power displayed in dBm or Watts The reference signal is used for downlink channel estimation Sync Signal SS Power Sync signal power displayed in dBm or Watts EVM rms The RMS of all the error vectors between the reconstructed ideal signals and the received signals divided...

Page 735: ...GPP MG Measurement Setup 1 Press the Measurements main menu key 2 Press the TD LTE Summary submenu key to activate and display the TD LTE measurements in table format Figure 6 15 TD LTE Summary ООО Техэнком Контрольно измерительные приборы и оборудование www tehencom com ...

Page 736: ...Marker Marker Select M1 M2 Marker State Off On Delta Marker Edit Reference Delta Peak Search Markers Off C Back Sync Sync Type Normal SS RS Cell ID A Standard List Display All Fav Select Deselect Favorite Save Favorites Top of List Page Up Page Down Bottom of List View Frame Sub Frame Sub Frame Number 0 Power vs Time Back A Marker State Off On Marker Peak Search Marker Sub frame 0 Marker RB 0 in P...

Page 737: ...ower Show Mod Results On Off Control Channel EVM On Off Show Mod Results On Off OTA Scanner Bar Graph OTA Tx Test Back Tx Test Bar Graph SS Power Mapping Control Channel Power Ng 1 6 Tx Time Alignment Back SINR RSRQ RSRP SS Power Back Back Control Channels Display Mode Bar Graph Table Refer to Chapter 7 Save Recall Points Map Measurement Setup Point Distance Time Setup Coverage Mapping Back Start ...

Page 738: ...s continued Figure 6 18 TD LTE Menu Layout 3 of 3 Carrier Aggregation H CC1 CC2 CC3 Center Freq 1 000 GHz Channel Set CF To Closest Channel CC1 Back Back CC5 CC4 TAE Off On CC1 Off On Signal Standard BW 10 MHz ООО Техэнком Контрольно измерительные приборы и оборудование www tehencom com ...

Page 739: ...lect a channel number within the range of the selected signal standard Set CF to Closest Channel Moves the center frequency to the closest frequency that matches a channel number in the current signal standard Decrement Channel Decrements the channel by one channel Increment Channel Increments the channel by one channel Channel Step Size Use this submenu key to specify the step size used for incre...

Page 740: ...tandard will be marked as favorites in the Fav column Top of List Press this submenu key to display the first signal standard in the list Page Up Press this submenu key to scroll up one page in the signal standard list Page Down Press this submenu key to scroll down one page in the signal standard list Bottom of List Press this submenu key to display the last signal standard in the list Press Esc ...

Page 741: ... below the Amplitude menu Enter a value then press the appropriate Units key to make your selection A negative offset value in external gain equates to the same amount of external loss For example entering 1 0 dB in Ext Gain is the same as 1 0 db of Ext Loss Auto Range Press this submenu key to toggle the Auto Range function between On and Off When set to On the instrument adjusts the reference le...

Page 742: ...t and the constellation measurement will only show QPSK The instrument will automatically choose PBCH Only mode when the OTA Scanner is used Sync Press this key to open the Sync Menu on page 6 32 Freq Err Avg Cnt When the count is greater than one the frequency error value is averaged over past measurements If the count is one then no averaging occurs U D Link Config Press this key to set the Upli...

Page 743: ...ulated from the last measured signal with an SS Back Press this submenu key to return to the Setup Menu on page 6 31 Figure 6 24 TD LTE Sync Menu Trigger Source Press this key to choose between No Trig or External Ext When Ext is chosen the instrument uses an external trigger input to determine frame start timing for data acquisition The internal algorithms will search for a frame sync and use the...

Page 744: ...esting TD LTE Summary Press this submenu key to display a table of the TD LTE measurements The following measurement values are displayed in the table Freq Error Occupied BW Carrier Frequency Channel Power Ref Signal RS Power Sync Signal SS Power EVM rms PBCH Power PCFICH Power Spectral Emission Mask Save Measurement Press this submenu key to save a measurement You may accept the default filename ...

Page 745: ...ent supports the testing for Operating Band Unwanted Emissions described in the 3GPP TS 36 141 Base Station Conformance testing document There is support for Category A and Category B Option 1 only masks which are automatically selected based on the current carrier frequency channel and BW values The instrument indicates if the signal is within the specified limits by displaying PASS or FAIL The e...

Page 746: ...15 MHz 20 MHz or 30 MHz Back Returns to the RF Menu on page 6 34 Figure 6 28 TD LTE Channel Spectrum Menu View Press to select either Frame or Sub Frame Sub Frame Number If Sub Frame is selected press to enter the desired sub frame to view Back Returns to the RF Menu on page 6 34 Figure 6 29 TD LTE Power vs Time Menu Back Channel Spectrum Span 10 MHz View Frame Sub Frame Sub Frame Number 0 Power v...

Page 747: ...k Auto Displays a list of standard and custom masks for use in SEM measurements Select Auto Select if the desired mask is unknown Summary Table Displays the Spectral Emission measurement data in table form Back Returns to the RF Menu on page 6 34 Figure 6 30 TD LTE Spectral Emission Menu Category A B Opt 1 Summary Table Off On Spectral Emission Back Select Mask Auto ООО Техэнком Контрольно измерит...

Page 748: ...ss the Control Channel Power submenu key to set the display as bar graph or table Refer to the Control Channel Power Menu on page 6 40 Tx Time Alignment Press to set the modulation measurement to Tx Time Alignment view Refer to Tx Time Alignment on page 6 15 Modulation Summary Press this submenu key to display a summary table of all of the modulation related numerical measurement results Ref Signa...

Page 749: ...he color map RB Color Map Max Value Press to adjust the RB Color Map Max Value manually RB Color Map Range Press to adjust the RB Color Range manually Back Press this submenu key to return to the Modulation Menu on page 6 37 Figure 6 32 TD LTE Power vs Resource Block Menu Back Power vs RB Autoscale Color Map RB Color Map Max Value 0 0 dBm RB Color Map Range 100 dB ООО Техэнком Контрольно измерител...

Page 750: ...n and Off On is the default state Back Press this submenu key to return to the Modulation Menu on page 6 37 The constellations are color coded as follows QPSK is shown in purple 16 QAM is shown in green 64 QAM is shown in yellow Values for the following measurements are shown beneath the graph Ref Signal RS Power EVM rms Freq Error Carrier Frequency Sync Signal SS Power EVM pk Freq Error ppm Cell ...

Page 751: ... column is included to display the EVM of each control channel The EVM column is included for either Bar Graph or Table displays Ng 1 6 Determines the number of PHICH groups in a LTE sub frame Back Press this submenu key to return to the Modulation Menu on page 6 37 Figure 6 34 TD LTE Control Channel Menu Control Channels Display Mode Bar Graph Table Control Channel EVM On Off Ng 1 6 Back ООО Техэ...

Page 752: ...mapping parameters Save Recall Points Map Measurement Setup and Point Distance Time Setup For full details refer to Chapter 7 LTE and TD LTE Coverage Mapping Carrier Aggregation Press this submenu key to display the Carrier Aggregation Component Carrier frequencies and measured parameters In the Carrier Aggregation Menu select the desired Component Carrier to set up for measurement Refer to Carrie...

Page 753: ...measurement records The instrument logs a data record at the end of each measurement cycle A maximum of 10 000 records can be stored in a file When a file is full a new file is automatically created Files are automatically saved to the instrument s Current Location selection in the subdirectory Internal Memory user Refer to the File Management chapter in your instrument User Guide for instructions...

Page 754: ...e PBCH Results table and Antenna Status indicators are not displayed When set to On the Antenna Status and PBCH Modulation Results table are displayed Back Press this submenu key to return to the Over the Air Menu on page 6 41 Figure 6 37 TD LTE Over the Air Tx Test Menu Back Show Mod Results On Off OTA Tx Test ООО Техэнком Контрольно измерительные приборы и оборудование www tehencom com ...

Page 755: ...15 Back Returns to the Over the Air Menu on page 6 41 Start Stop Data Collection Press this main menu key to start coverage mapping data collection based on Measurement Setup settings and Point Distance Time Setup settings A running count of collected data points is displayed at the bottom of the screen Press again to stop data collection Figure 6 38 Coverage Mapping Menu Save Recall Points Map Me...

Page 756: ...ents the frequency is automatically set to the currently selected Component Carrier if it is on TAE Time Alignment Error TAE is a measurement of the differential transmission delay between the Component Carriers The 3GPP specification identifies the limits of the delays for the system to operate properly Back Returns to the Over the Air Menu on page 6 41 Figure 6 39 Carrier Aggregation Menu Carrie...

Page 757: ...value then press the desired unit submenu key or press Enter to select MHz as the frequency unit Signal Standard Opens the Standard List Menu on page 6 29 Channel Opens the Channel Editor dialog where you can select a channel number within the range of the selected signal standard Set CF to Closest Channel Moves the center frequency to the closest frequency that matches a channel number in the cur...

Page 758: ...he arrow keys or rotary knob and press Enter to start the test or press Esc to cancel your choice Note The current list of pass fail tests is a default list Master Software Tools MST includes features to create additional pass fail tests Reset Press this submenu key to restart the measurement or to begin a new pass fail test measurement Back Press this submenu key to return to the Measurements Men...

Page 759: ...e selected marker underlined in the Marker Select submenu Marker Edit Displays when the Market State submenu is set to Delta Toggles between activating the Reference or Delta marker Peak Search Moves the selected marker to the trace peak Markers Off Turns off all markers Back Press this submenu key to return to the Measurements Menu on page 6 33 Figure 6 42 TD LTE Marker Menu Back Marker Marker Se...

Page 760: ... Delta marker Peak Search Moves the selected marker to the trace peak Markers Off Turns off all markers Back Press this submenu key to return to Measurements Menu on page 6 33 Figure 6 43 TD LTE Resource Block Marker Menu Sweep Single Continuous This submenu key toggles between continuous sweep and single sweep In single sweep mode the results of a sweep are displayed on the screen while the instr...

Page 761: ...nts Menu on page 6 33 6 17 Trace Menu This menu is not available in TD LTE measurement mode 6 18 Limit Menu This menu is not available in TD LTE measurement mode 6 19 Other Menus Preset File Mode and System are described in the User Guide ООО Техэнком Контрольно измерительные приборы и оборудование www tehencom com ...

Page 762: ...file with a map Coverage Mapping is possible both outdoors GPS signal required and indoors no GPS signal For more accurate position data for indoor measurements use a stylus such as the Anritsu 2000 1691 R Outdoor Mapping The instrument logs data automatically based on either time or distance interval If there is no map available when making the measurements it is still possible to save all the da...

Page 763: ...h location Indoor Coverage With GPS turned off and a non GeoEmbedded map file the user indicates the current position with the touchscreen On instruments that do not have a touchscreen use the arrow keys Previously saved locations are displayed as colored squares Figure 7 1 Outdoor Coverage Mapping GPS On Figure 7 2 Indoor Coverage Mapping GPS Off Start Data Collection Current Location Stop Data C...

Page 764: ...y map map files azm map files which are displayed in full zoom out view pan and zoom is currently not supported in Coverage Mapping Download easyMap Tools from the Anritsu website www anritsu com Additional information about easyMap Tools is available in the software Help Outdoor Map Type an address in easyMap Tools and capture the map with GPS data Indoor Map In easyMap Tools open a bitmapped ima...

Page 765: ...the top of the screen turns green Refer to your instrument User Guide for additional information on GPS Recall a Map The instrument allows you to recall a map file or azm file created with easyMap Tools With a valid GPS signal the current location will be displayed on an outdoor map or an arrow will show the direction of the current location if it is outside the map coverage area With an indoor ma...

Page 766: ...ll a map after taking the data without having to save and recall it Alternatively you can save the KML points and view them in Google Earth or Google Maps or you can save the points in mtd mapping tab delimited format and use another tool for analysis such as Microsoft Excel Refer to Mapping Save Recall Menu on page 7 13 for additional information on recalling saved maps and kml data 1 Select the ...

Page 767: ...Setup submenu button to open the Points Distance Time menu If Time is selected for Repeat Type then set the time period by pressing the Repeat Time submenu key If Distance is selected for Repeat Type then set the Repeat Distance and Distance Units If necessary delete any previously stored points by pressing the Delete ALL Points button 7 Press Back to return to the Over the Air menu Measurement Ma...

Page 768: ...ayed on the screen Location and time based on GPS information Cell Group and Sector ID Center Frequency Measured signals S SS RSRP RSRQ and SINR The kml file can be recalled and viewed on the instrument Refer to Mapping Save Recall Menu on page 7 13 for information on recalling a map The kml file can also be opened and viewed using Google Earth and a network connection 1 Connect your computer or m...

Page 769: ... view in Google Earth See Figure 7 4 3 Click the map file name in the File column Alternatively you can select the checkbox next to the kml file name then click the Download button 4 Click Open or Save in the pop up dialog Figure 7 4 Web Remote Control Window File List Tab ООО Техэнком Контрольно измерительные приборы и оборудование www tehencom com ...

Page 770: ...vided you have the appropriate plug in for your browser Save Tab Delimited Points In the Coverage Mapping submenu press Save Recall Points Map then Save Tab Delimited Points In the Save dialog change the file name as appropriate then press Enter A tab delimited text file mtd of the coverage mapping data currently displayed on the screen will be saved to the default location Figure 7 5 Sample Cover...

Page 771: ...bmenu press Save Recall Points Map then Save JPG In the Save dialog change the file name as appropriate then press Enter A jpg file of the current screen is saved to the default location Figure 7 6 Coverage Mapping Measurement Saved as a jpg File ООО Техэнком Контрольно измерительные приборы и оборудование www tehencom com ...

Page 772: ...B C D E Repeat Type Time Distance Distance Units m ft Start Data Collection Over the Air Scanner Tx Test Mapping Mapping Parameter A S SS Power RSRP RSRQ SINR Back SS Power B Excellent 107 0 dBm Very Good 110 0 dBm Good 114 0 dBm Fair 117 0 dBm Poor 120 0 dBm Back RSRP Levels C Excellent 107 0 dBm Very Good 110 0 dBm Good 114 0 dBm Fair 117 0 dBm Poor 120 0 dBm Back RSRQ Levels D Excellent 0 0 dB ...

Page 773: ...o the Over the Air Menu on page 5 37 LTE or Over the Air Menu on page 6 41 TD LTE Start Stop Data Collection Press this main menu key to start collection of coverage mapping data based on the settings of Measurement Setup and Point Distance Time Setup A running count of collected data points is displayed at the bottom of the map Press this key again to stop data collection Figure 7 8 Coverage Mapp...

Page 774: ...ecall KML Points Only Opens the Recall submenu for selecting a kml file Displays the saved locations overlaid on the current map or the default grid Recall KML Points With Map Opens the Recall submenu for selecting a kml file The map that was used when the points were saved will be recalled if it is available Recall Default Grid If you do not have a GPS embedded map but are out in the field making...

Page 775: ...level Use the arrows knob or numeric keypad to change its value Press Enter Press Back to return to the Measurement Setup Menu RSRQ Thresholds Opens the RSRQ Levels menu for setting threshold levels RSRQ Levels Set the RSRQ threshold levels as desired Press the desired threshold level Use the arrows knob or numeric keypad to change its value Press Enter Press Back to return to the Measurement Setu...

Page 776: ...S is Off the instrument interpolates position measurements in a straight line between each pair of screen tap locations Repeat Distance When the Repeat Type is Distance and GPS is turned On for outdoor mapping use this submenu key to set the distance interval between measurements For indoor mapping GPS is Off the instrument places all new measurements at the next screen tap location Distance Units...

Page 777: ...7 5 Coverage Mapping Menu LTE and TD LTE Coverage Mapping 7 16 PN 10580 00234 Rev T 3GPP MG ООО Техэнком Контрольно измерительные приборы и оборудование www tehencom com ...

Page 778: ...d signal analyzer technical data sheets 8 2 Connecting the Antenna 1 Connect the antenna RF connector to the Analyzer RF In port on the instrument See Figure 8 1 The antenna connector must be finger tight 2 Connect the antenna USB connector to one of the USB Type A ports on the instrument Note Not all instrument models offer every option Please refer to the Technical Data Sheet of your instrument ...

Page 779: ...en the specified number of measurements have completed Auto Logging On Off Auto Logging is On by default This must be selected prior to starting the measurements for the results to be logged The average max and min values of each isotropic set of three axes the isotropic trace data and the computed total average max and min values are saved in a tab delimited text file in internal memory The locat...

Page 780: ...as Display Opens the S SS Display Menu on page 8 6 Extr Factor On Off Toggles On Off the Extrapolation Factor The extrapolation factor if turned On displays the extrapolated field strength number for the selected capture bandwidth Back Returns to the LTE TD LTE EMF Menu on page 8 2 Figure 8 3 LTE TD LTE Meas Params Menu Meas Params Extr Factor On Off S SS Meas Display P SS Meas Display RS Meas Dis...

Page 781: ...RS Total Min Selects the display of Total Min which is the minimum value for the entire measurement period Measurement Time Number of Measurements RS Total Max Selects the display of Total Max which is the maximum value for the entire measurement period RS Avg Meas Selects the display of Avg Meas which is the running average for the current Measurement Time This is the default selection RS Total A...

Page 782: ... SS Total Min Selects the display of Total Min which is the minimum value for the entire measurement period Measurement Time Number of Measurements P SS Total Max Selects the display of Total Max which is the maximum value for the entire measurement period P SS Avg Meas Selects the display of Avg Meas which is the running average for the current Measurement Time This is the default selection P SS ...

Page 783: ...SS Total Min Selects the display of Total Min which is the minimum value for the entire measurement period Measurement Time Number of Measurements S SS Total Max Selects the display of Total Max which is the maximum value for the entire measurement period S SS Avg Meas Selects the display of Avg Meas which is the running average for the current Measurement Time This is the default selection S SS T...

Page 784: ...Meas the default and Total Avg Total Min Total Max and Total Avg are the min max and average values computed from all measurements completed thus far within the measurement period Measurement Time Number of Measurements Avg Meas is the running average of the isotropic results computed from all measurements completed thus far within the specified Measurement Time There is no axis dwell time paramet...

Page 785: ...ower level the Field Strength value for other BW setups can be extrapolated based on the Channel Power in 1 4 MHz BW The Field Strength cell labels in the table are updated with an Ex such as Field Strength Ex Avg to indicate the extrapolation factor has been applied See Figure 8 8 on page 8 9 The displayed values are measurement results from the BW setup made prior to starting the measurement Cha...

Page 786: ...the Final Test Status are marked as Fail in red If the Field Strength Avg does not exceed the limit the Current Test Status is marked as Pass in green In the example in Figure 8 8 the extrapolated Field Strength Ex Avg is 22 22 mV m If all of the measurements pass the Final Test Status is updated to Pass in green Figure 8 8 LTE TD LTE EMF Measurement Display ООО Техэнком Контрольно измерительные п...

Page 787: ...ment results and the instrument moves to the next axis Refer to Measurement Results W CDMA on page 8 14 Number of Measurements Sets the number of EMF measurements to complete from 1 up to 10 000 The EMF test is fully executed when the specified number of measurements have completed Auto Logging On Off Auto Logging is On by default This must be selected prior to starting the measurements for the re...

Page 788: ...the other units are selected the measurements are performed in power Watt units If you change the EMF units at the end of the measurement the values displayed are converted from the base units used during the measurement Limits A single number can be entered The Field Strength Avg value should stay below this limit default 6 V m for the test to pass Back Returns to the previous menu Figure 8 10 W ...

Page 789: ...eters On Off Switches On Off the manual codes Display Params Opens the Display Menu on page 8 13 Enter this submenu to select the parameter you want displayed in the rightmost column of the measurement results table Extr Factor The extrapolation factor when turned On 1 displays the extrapolated P CPICH numbers The field strength values are not extrapolated This parameter can be set between 1 and 1...

Page 790: ...th the desired extrapolation factor Total Min is the minimum value computed from all measurements completed thus far within the measurement period Measurement Time Number of Measurements Total Avg is the average value computed from all measurements completed thus far within the measurement period The remaining choices are coverage measurements computed as a ratio of common pilot signal to the chan...

Page 791: ...g average of the isotropic results computed from all measurements completed thus far within the specified Measurement Time Using the Display Params submenu you can select the computed result to display in the rightmost table column Refer to Display Menu on page 8 13 There is no axis dwell time parameter If a sync signal is not found within a specific time data for the current axis is excluded and ...

Page 792: ...vg Meas exceeds the set limit the Current and Final Test Status are marked as Fail in red If the Field Strength Avg Meas does not exceed the limit the Current Test Status is marked as Pass in green In the example in Figure 8 14 the Field Strength Avg Meas is 5 05 mV m If all of the measurements pass the Final Test Status is updated to Pass in green Note The extrapolation factor k is the ratio of t...

Page 793: ...8 4 W CDMA EMF Menu EMF Option 444 8 16 PN 10580 00234 Rev T 3GPP MG ООО Техэнком Контрольно измерительные приборы и оборудование www tehencom com ...

Page 794: ...t power 3 Level Under a If Auto Range is On No signal detected Increase input power b If Auto Range is Off Adjust range or increase input power 4 Out of band saturation When the software detects that there is too much power outside the current frequency range this message is displayed This usually means that the instrument is currently tuned to a frequency with a very low amplitude signal or no si...

Page 795: ... RS this message is displayed All Measurement results are cleared A 4 TD LTE Messages 1 Sync signal not found When the firmware does not find a synchronization signal P SS and S SS this message is displayed Measurement results are cleared is seen in the result area for all modulation and Scanner results Channel Power will continue to be displayed 2 No Trigger found When Trigger is set to External ...

Page 796: ...3 37 constellation 3 4 5 35 6 10 6 39 contacting Anritsu 1 3 control channel power 5 10 5 36 6 11 6 40 coverage mapping 7 1 7 11 D demodulator GSM GPRS EDGE 2 5 2 15 TD SCDMA HSPA 4 7 4 24 WCDMA HSPA 3 14 3 34 dominance 5 16 6 17 downlink pilot time slot power 6 2 E Ec 3 4 Ec Io 3 4 EMF measurement 8 2 8 10 menu 8 2 8 10 Error Vector Magnitude EVM 3 3 4 8 5 9 6 10 F freq error 2 8 3 3 4 7 5 9 6 10...

Page 797: ...ak CD Error 3 4 peak phase error 2 8 peak to average power 3 4 PHICH 5 10 6 11 Physical Broadcast Channel power 5 10 6 11 Physical Control Format Indicator Channel power 5 10 6 11 Physical Downlink Control Channel 5 10 6 11 Physical Hybrid Automatic Repeat Request Indicator Channel 5 10 6 11 pilot dominance 3 4 power vs resource block 5 8 5 34 6 9 6 38 power vs time 2 4 6 2 6 5 6 35 Primary Sync S...

Page 798: ...D LTE menu map 6 25 signal analyzer 6 1 TD SCDMA HSPA menu map 4 13 signal analyzer 4 1 threshold 3 3 Time Alignment Error 5 18 5 41 6 19 6 45 timing error 6 3 total frame power 6 2 transmit off power 6 2 trigger menu 4 18 Tx test LTE 5 17 TD LTE 6 18 Tx Time alignment 5 10 5 14 6 11 6 15 W WCDMA summary 3 22 WCDMA HSPA measurements 3 7 menu map 3 24 signal analyzer 3 1 threshold setup 3 6 web lin...

Page 799: ...Index 4 PN 10580 00234 Rev T 3GPP MG ООО Техэнком Контрольно измерительные приборы и оборудование www tehencom com ...

Page 800: ...ООО Техэнком Контрольно измерительные приборы и оборудование www tehencom com ...

Page 801: ...0 Jarvis Drive Morgan Hill CA 95037 2809 USA http www anritsu com Anritsu utilizes recycled paper and environmentally conscious inks and toner ООО Техэнком Контрольно измерительные приборы и оборудование www tehencom com ...

Page 802: ...option CDMA EV DO Option 884 Note Not all instrument models offer every option or every measurement within a given option Please refer to the Technical Data Sheet of your instrument for available options and measurements within the options Anritsu Company 490 Jarvis Drive Morgan Hill CA 95037 2809 USA Part Number 10580 00235 Revision D Published December 2012 Copyright 2009 2012 Anritsu Company ОО...

Page 803: ...ty of Anritsu Company and any unauthorized use or disclosure of these drawings specifications and information is prohibited they shall not be reproduced copied or used in whole or in part as the basis for manufacture or sale of the equipment or software programs without the prior written consent of Anritsu Company UPDATES Updates if any can be downloaded from the Anritsu Website at http www anrits...

Page 804: ...own in the diagrams in this manual This indicates a prohibited operation The prohibited operation is indicated symbolically in or near the barred circle This indicates a compulsory safety precaution The required operation is indicated symbolically in or near the circle This indicates a warning or caution The contents are indicated symbolically in or near the triangle This indicates a note The cont...

Page 805: ...e internal components Only qualified service technicians with a knowledge of electrical fire and shock hazards should service this equipment There are high voltage parts in this equipment presenting a risk of severe injury or fatal electric shock to untrained personnel In addition there is a risk of damage to precision components Caution Electrostatic Discharge ESD can damage the highly sensitive ...

Page 806: ...Setup 2 4 Channel Spectrum Setup 2 4 Spurious Emission Setup 2 5 ACPR Setup 2 6 2 5 CDMA Demodulator Measurements Setup 2 7 CDP Setup 2 8 CDP Table View Setup 2 9 2 6 CDMA Over The Air Measurement Setup 2 10 Pilot Scan Setup 2 11 Multipath Setup 2 12 Limit Test Setup 2 13 2 7 Pass Fail Setup 2 14 2 8 CDMA Measurement Descriptions 2 15 RF Measurements 2 15 Demodulator Measurements 2 15 OTA Measurem...

Page 807: ... EVDO Measurement Setup 3 2 PN Select Setup 3 2 MAC Codes Setup 3 3 3 4 EVDO RF Measurements Setup 3 3 Channel Spectrum Setup 3 3 Power vs Time Setup 3 4 ACPR Setup 3 5 Spurious Emission Setup 3 6 3 5 EVDO Demodulator Measurements Setup 3 7 CDP MAC Setup 3 8 Marker Setup Activating Markers 3 8 CDP Data Setup 3 9 MAC CDP Table Setup 3 10 EVDO Modulation Summary Setup 3 11 3 6 EVDO Over The Air Meas...

Page 808: ...nu Continued 3 29 CDP MAC Menu 3 30 CDP Data Menu 3 30 Over The Air Menu 3 31 Pass Fail Mode Menu 3 31 3 15 Markers Menu 3 32 3 16 Sweep Menu 3 32 3 17 Measure Menu 3 33 3 18 Trace Menu 3 33 3 19 Limit Menu 3 33 3 20 Other Menus 3 33 Appendix A Error Messages A 1 Introduction A 1 A 2 CDMA and EVDO Messages A 1 Warning Messages A 1 Index ООО Техэнком Контрольно измерительные приборы и оборудование ...

Page 809: ...Contents 4 PN 10580 00235 Rev D 3GPP2 MG ООО Техэнком Контрольно измерительные приборы и оборудование www tehencom com ...

Page 810: ... CDMA Demodulation Option 0033 CDMA Over the Air OTA Measurements Option 0884 CDMA EV DO Measurements requires Option 9 EV DO signal analysis is described in Chapter 3 EVDO Signal Analyzer Option 0062 EV DO RF Measurements Option 0063 EV DO Demodulation Option 0034 EV DO OTA Measurements Option 0884 CDMA EV DO Measurements requires Option 9 Note Not all instrument models offer every option Please ...

Page 811: ...easurement mode using the Up or Down arrow keys and press Enter Some Anritsu handheld instruments also have a Menu button which displays icons of installed measurement modes and allows measurement mode selection using the touch screen Refer to the instrument User Guide for additional information Figure 1 1 Mode Selector Dialog Box Figure 1 2 Mode Selector Dialog Box ООО Техэнком Контрольно измерит...

Page 812: ...t information in your country or region provide online feedback complete a Talk to Anritsu form to have your questions answered or obtain other services offered by Anritsu Updated product information can be found on the Anritsu web site http www anritsu com Search for the product model number The latest documentation is on the product page under the Library tab ООО Техэнком Контрольно измерительны...

Page 813: ...1 4 Contacting Anritsu General Information 1 4 PN 10580 00235 Rev D 3GPP2 MG ООО Техэнком Контрольно измерительные приборы и оборудование www tehencom com ...

Page 814: ... loss for compensating external loss limit lines markers and file management 2 3 CDMA Measurement Setup Anritsu instruments can measure CDMA performance over the air with an antenna or by connecting the base station directly To measure a CDMA signal over the air connect the appropriate frequency band antenna to the instrument s RF Input connector and connect a GPS antenna to the GPS connector To c...

Page 815: ...ally detects the strongest pilot while in Manual mode it searches only for the specified PN 5 Press Back to return to the previous menu No Trigger If both GPS and external timing are unavailable then you may choose No Trigger for the PN search GPS Uses GPS as the timing reference External The instrument uses an external even second time mark as the timing reference The time mark is usually availab...

Page 816: ... the timing circuit which reduces frequency error To configure GPS use the following procedure Install a GPS antenna to the GPS antenna connection on the instrument s connector panel See the User Guide for additional information about GPS setup Figure 2 2 Walsh Codes Setup Caution A DC voltage is present on the GPS connector Never connect anything other than a GPS antenna to this port Note CDMA ba...

Page 817: ...measurement menu Channel Spectrum Setup This measurement displays the spectrum of the specified channel and channel power occupied bandwidth and peak to average power From the Measurements main menu use the following procedure for Channel Spectrum 1 Press the RF Measurements submenu key to open the RF Measurements menu 2 Press Channel Spectrum to display the active measurement Figure 2 3 Figure 2 ...

Page 818: ...rmine a PASS or FAIL according to limits that are set by the signal standard A blue mask is also calculated and shown on the spectrum to visually check for pass fail conditions From the Measurement menu use the following procedure for Spurious Emission 1 Press the RF Measurement submenu key 2 Press the Spurious Emission submenu key to activate the measurement Figure 2 4 The red dot on the submenu ...

Page 819: ... under the bar graph From the Measurement menu use the following procedure for ACPR 1 Press the RF Measurement submenu key 2 Press the ACPR submenu key to activate the ACPR measurement Figure 2 5 The red dot on the submenu key indicates that it is selected 3 Press the ACPR submenu key again to specify the Number of Carriers in a multi carrier configuration and to specify Carrier BW Figure 2 5 RF M...

Page 820: ...ation and follow these setup instructions 1 Press the Setup main menu key to open the Setup menu 2 Press the PN Setup submenu key and choose No Trig GPS or External 3 Press the PN Search Type submenu key and select Auto search or Manual search by toggling the submenu key 4 Press Back to go to the previous Setup menu 5 Press the Walsh Codes submenu key to choose 64 codes or 128 codes based on the t...

Page 821: ...ts are displayed as numerical values From the Demodulator submenu use the following procedure for CDP 1 Press the CDP submenu key to display the Code Domain Power menus This may require pressing the CDP submenu key a second time Figure 2 6 2 Press the Zoom submenu key to activate zoom for 16 32 or 64 codes 3 Press the Zoom Start Index submenu key and enter the desired location manually 4 Press CDP...

Page 822: ...ey to display the Code Domain Power menus 2 Press the Zoom submenu key to activate zoom for 16 32 or 64 codes 3 Press the Zoom Start Index submenu key and enter the desired location manually 4 Press CDP Units to select either Relative power in dB or Absolute power in dBm 5 Press Back to go back to the previous menu 6 Press the CDP Table submenu key to display the measurements Figure 2 7 Figure 2 7...

Page 823: ... the base station condition The result is fewer NTFs and elimination of associated costs If you choose to measure CDMA performance over the air with an antenna then additional setup is required as explained in the following sections The instrument needs a timing reference to determine PN Offset and timing errors This reference comes from the base station GPS when it is connected to the instrument ...

Page 824: ... Setup From the Over The Air menu press the Pilot Scan submenu key to display the nine strongest pilots the PN codes Ec Io Tau Pilot Power Channel Power and Pilot Dominance Figure 2 8 Figure 2 8 Over The Air Pilot Scan Measurement ООО Техэнком Контрольно измерительные приборы и оборудование www tehencom com ...

Page 825: ...580 00235 Rev D 3GPP2 MG Multipath Setup From the Over The Air menu press the Multipath submenu key to measure and display multipath parameters Figure 2 9 Over The Air Pilot Multipath Measurement ООО Техэнком Контрольно измерительные приборы и оборудование www tehencom com ...

Page 826: ...enu key 2 Start or restart the measurement by pressing the Start Restart Measurement submenu key The test takes ten measurements and displays pass or fail status for each measurement After the ten measurements are taken the average for the five parameters is calculated and a pass or fail status is displayed 3 To set new limits from the current limit average values press the Set Avg Measured Values...

Page 827: ...ed into the instrument using Master Software Tools All critical parameters can be selected for pass fail testing From the Measurements main menu use the following procedure for Pass Fail setup 1 Press the Pass Fail Mode submenu key to display the pass fail measurements 2 Press the Pass Fail Mode submenu key again to display the Pass Fail Mode menu 3 Press the Select Pass Fail Test submenu key and ...

Page 828: ... displayed below the measurement and include the power and frequency at each marker along with a pass fail indication ACPR This function displays from 1 to 5 channels carriers and two adjacent channels on each side The power of each channel is displayed below the measurement graph and includes the frequency and power in each of the 4 adjacent channels RF Summary This function displays a table view...

Page 829: ...mon measurements are 0 94 Due to environmental factors rho values are typically poor 0 9 when measured over the air and are usually useful only when connected to a base station Sync Power Sync Power is a measure of Sync Walsh Code power displayed in dBm Tau Tau is the timing error It is the timing offset or the difference in time between when the PN sequence or short code restarts and when the PN ...

Page 830: ...d then check that the entered power offset is correct and that the connections are tight Unexpected readings may indicate an incorrect power setting at the base station For Over The Air OTA measurements the pilot power will vary as the signal path from the transmitter to receiver varies Channel Power Channel power is the total power that is broadcast in the specified CDMA channel Pilot Dominance P...

Page 831: ...surement RF Measurements Spurious Emmision ACPR RF Summary Channel Spectrum Back ACPR Number of Carriers Back PN Setup PN Trigger No Trig GPS Ext Back PN Search Type Auto Manual PN Increment 1 Manual PN Offset N A Setup PN Setup Walsh Codes 64 128 Meas Speed Fast Norm Slow Ext Trig Polarity Rising Falling Number of Carriers 1 Carrier BW MHz 1 23 1 24 1 25 Carrier BW MHz 1 23 1 24 1 25 Ch Spectrum ...

Page 832: ...Scan Back Limit Test Rho Limit 0 800 Adj Rho Limit 0 850 Multipath Limit 0 3 dB Pilot Dom Limit 13 0 dB Pilot Pwr Limit 80 0 dBm Set Avg Measured Values as New Limits Start Restart Measurement Back Pass Fail Mode Select Pass Fail Test Back Reset C D E CDP CDP Units Relative Absolute Back Zoom Start Index 0 Zoom 16 32 64 ООО Техэнком Контрольно измерительные приборы и оборудование www tehencom com ...

Page 833: ...x includes all of the CDMA standards Channel Use the Up Down arrow keys the keypad or the rotary knob to select a channel number for the selected signal standard The center of the channel is automatically tuned to the center frequency of the selected CDMA channel The Channel Editor dialog box indicates the selected signal standard The range of channels and the channel step size depend upon the sel...

Page 834: ...and couplers The power can be offset from 0 dB to 100 dB Press the Power Offset key enter the values and press the dB submenu key Auto Range Pressing this submenu key toggles between On and Off This function adjusts the reference level automatically when Auto Range is activated Adjust Range When Auto Range is OFF pressing Adjust Range sets the Reference Level automatically for that one particular ...

Page 835: ...g edge and Falling edge trigger polarity Number of Carriers This submenu key sets the number of required channels This affects the ACPR and Spurious Emissions measurements Carrier BW This submenu key sets the carrier bandwidth It rotates between 1 23 1 24 and 1 25 Figure 2 16 CDMA Setup Menu Setup PN Setup Walsh Codes 64 128 Meas Speed Fast Norm Slow Ext Trig Polarity Rising Falling Number of Carr...

Page 836: ...nal Manual PN Offset Press to manually set the PN offset Use the arrow keys rotary knob or numeric keypad to choose an offset then press the rotary knob or the Enter key to select the value Editing this value automatically changes the PN Search Type to Manual The Manual PN Offset function is available only when the trigger selection is GPS or External If No Trig is selected then pressing this subm...

Page 837: ...odes Ec Io dB Tau Pilot Power Channel Power Pilot Dominance and Multipath Pass Fail Mode The first press of this submenu key puts the instrument into Pass Fail Mode The next press of the submenu key opens the Pass Fail Mode Menu on page 2 29 CDMA Summary Displays a summary of all of the CDMA related numerical measurements in a table format Save Measurement Opens a dialog box to name and save the c...

Page 838: ... all the RF numerical measurement results Back Returns to the Measurements Menu on page 2 24 Figure 2 19 CDMA RF Measurement Menu Number of Carriers Press this submenu key to set the number of main channels from 1 to 5 Change the number of main channels with the arrow keys or the rotary knob then press the rotary knob or the Enter key Or change the number of channels by pressing a number on the nu...

Page 839: ...r power and code type The codes are color coded as follows Pilot in Red Page in Green Sync in Blue cdmaOne IS95 Traffic in Yellow CDMA2000 1xRTT Traffic in Orange An additional press of the CDP submenu key opens the CDP Menu on page 2 27 CDP Table This screen shows the power of the codes in a tabular format The table displays the following five columns Code Code number Status Pilot Page Sync All T...

Page 840: ...are Relative the code power is measured relative to Channel Power Back Returns to the Demodulator Menu on page 2 26 Figure 2 22 CDMA CDP Menu Pilot Scan Displays the power of the 9 strongest PNs in histogram graphical format The strongest PN or the user selected PN is color coded blue those colored red are probably real pilots and the remaining which are color coded gray are probably noise Multipa...

Page 841: ...easured Values as Limits Takes the calculated average values for Rho Adjusted Rho Multipath Pilot Dominance and Pilot Power in the Avg row and places them in the Limits row Back Returns to the Over The Air Menu on page 2 27 Figure 2 24 CDMA Limit Test Menu Limit Test Rho Limit 0 800 Adj Rho Limit 0 850 Multipath Limit 0 3 dB Pilot Dom Limit 13 0 dB Pilot Pwr Limit 80 0 dBm Set Avg Measured Values ...

Page 842: ...e 2 25 CDMA Pass Fail Mode Menu Markers are available only in CDP and Spectrum measurements Marker Selects the active marker 1 to 6 The underlined marker number is the active marker Each press of the submenu key moves the underline to the next marker number Pressing Shift causes reverses the direction of marker selection Press the Shift button again to change back to the original direction On Off ...

Page 843: ...nt User Guide Sweep Single Continuous This submenu key toggles between continuous sweep and single sweep In single sweep mode the results of a sweep are displayed on the screen while the instrument awaits a trigger event to start a new sweep Trigger Sweep Pressing this submenu key causes the instrument to make a single sweep when the instrument is in single sweep mode This key has no function when...

Page 844: ...he EVDO Access Terminals for example cell phones laptops and so forth The MAC Medium Access Control Channel controls the overall EVDO traffic The Data Channel transmits data to various users The Pilot and MAC Channels are always active in an EVDO signal but the Data Channel may sometimes transmit no data When no data is transmitted the half slot is considered idle Otherwise it is called an active ...

Page 845: ...igger submenu key to toggle through No trigger GPS or External 4 Press the PN Search Type submenu key to toggle between Auto or Manual In Auto mode the instrument automatically detects the strongest pilot while in Manual mode it searches only for the specified PN 5 Press Back to return to the previous menu No Trigger If both GPS and external timing are unavailable then you may choose No Trigger fo...

Page 846: ...nstrument to the base station following the setup instructions Press the Measurement and RF Measurement submenu keys to open the measurement menu Channel Spectrum Setup This measurement displays the spectrum of the specified channel and channel power occupied bandwidth and peak to average power 1 Press the RF Measurement submenu key to open the RF Measurement menu 2 Press Channel Spectrum to displ...

Page 847: ... 4 PN 10580 00235 Rev D 3GPP2 MG Power vs Time Setup From the RF Measurement menu press Power vs Time to display the active measurement Figure 3 3 Figure 3 3 EVDO Power vs Time ООО Техэнком Контрольно измерительные приборы и оборудование www tehencom com ...

Page 848: ...d in table format under the bar graph From the RF Measurement menu use the following procedure for ACPR 1 Press the ACPR submenu key to activate the ACPR measurement Figure 3 4 The red dot on the submenu key indicates that it is selected 2 Press the ACPR submenu key again to specify the Number of Carriers in a multi carrier configuration and to specify Carrier BW Figure 3 4 EVDO ACPR Measurement О...

Page 849: ...are required to input an all idle or all active signal and to set the instrument slot setting accordingly The emission mask is drawn according to the following document Recommended Minimum Performance Standards for cdma2000 High Rate Packet Data Access Network See 3GPP2 C S0032 A or TIA 864 A for details From the RF Measurement menu press the Spurious Emission submenu key to activate the measureme...

Page 850: ...up submenu key and choose the trigger type No Trigger No Trig GPS or External Ext 3 Press PN Search Type submenu key to toggle between Auto and Manual search 4 Press Back to go to the previous menu 5 Press the Walsh Codes submenu key to choose 64 codes or 128 codes 6 Press the Measurement main menu key to open the measurements menu 7 Press the Demodulator submenu key to activate the Demodulator me...

Page 851: ... zoom starting code 5 Press CDP Units submenu key to select Relative power in dB or Absolute Power in dBm for the y axis in the graphic display Marker Setup Activating Markers 1 Press the Marker main menu key to display the Marker menu 2 Press the Marker submenu key to select the appropriate marker 1 through 6 The underlined marker number is the currently selected marker 3 Press the On Off submenu...

Page 852: ... the Demodulator menu use the following procedure for CDP Data measurements 1 Press the CDP Data submenu key to display the codes 2 Press the CDP Data submenu key again to display the CDP Data submenu 3 Press the CDP Units submenu key to select Relative power in dB or Absolute power in dBm Figure 3 7 EVDO CDP Data ООО Техэнком Контрольно измерительные приборы и оборудование www tehencom com ...

Page 853: ...le Setup The MAC CDP Table View displays all of the active codes in a tabular format From the Demodulator menu press the MAC CDP Table submenu key to display the Code Domain Power table view Figure 3 8 Figure 3 8 EVDO MAC CDP Table ООО Техэнком Контрольно измерительные приборы и оборудование www tehencom com ...

Page 854: ...EVDO modulation summary view displays EVDO critical RF and demodulator measurements in tabular format From the Demodulator menu press the Modulation Summary submenu key to display the summary of measurements Figure 3 9 Figure 3 9 EVDO Modulation Summary ООО Техэнком Контрольно измерительные приборы и оборудование www tehencom com ...

Page 855: ...termine PN Offset and timing errors This reference comes from the base station GPS when it is connected to the instrument or it can be recovered from GPS when a GPS antenna is connected To make EVDO OTA measurements connect the instrument to the base station and perform the following setup procedure 1 Press Freq main menu key then press the Channel submenu key and use the Up Down arrow keys the ke...

Page 856: ... key to display the nine strongest pilots the PN codes Ec Io Tau Pilot Power Channel Power and Pilot dominance Figure 3 10 From the OTA menu press the Multipath submenu key to display six channels of multipath parameters including Ec Io Tau Channel Power and Multipath Power Figure 3 11 Figure 3 10 EVDO OTA Pilot Scan Figure 3 11 EVDO OTA Multipath ООО Техэнком Контрольно измерительные приборы и об...

Page 857: ... list can be created and downloaded into the BTS Master All critical parameters can be selected for pass fail testing From the Measurements main menu use the following procedure to enter the Pass Fail Mode 1 Press the Pass Fail submenu key to display pass fail criteria 2 Press the Pass Fail submenu key again to open the Pass Fail Mode key menu 3 Press the Select Pass Fail Test submenu key and sele...

Page 858: ... format From the Measurements main menu press the EVDO Summary submenu key to display the measurements in tabular format Figure 3 13 From the Measurements menu press the Save Measurement submenu key to open a dialog box in order to name and save the current measurement Figure 3 13 Pass Fail Measurement ООО Техэнком Контрольно измерительные приборы и оборудование www tehencom com ...

Page 859: ...is expressed in dB When connected to a good EVDO source the noise floor should be 31 5 dB or below When noise or distortion is present for example in an over the air measurement the noise floor can be considerably higher Freq Error Frequency error is the difference between the received center frequency and the specified center frequency This is only as accurate as the frequency reference that is b...

Page 860: ...nnel in EVDO consists of 16 I sub channels and 16 Q sub channels Each of these channels should have a power of approximately 15 05 dB relative to the total Data Channel power When connected to a good signal source the Data Code Min is usually larger than 15 5 dB and the Data Code Max is usually less than 14 6 dB The smaller the difference between these two values the better the signal quality CDP ...

Page 861: ...to make good measurements Ec Io The pilot power compared to the total channel power during the pilot time slot Occupied BW The occupied bandwidth is calculated as the bandwidth containing 99 of the transmitted power in a 2 5 MHz span Power vs Time Graph This view shows the time domain view of an EVDO half slot The Slot Type selection in the Setup menu determines the priorities regarding which slot...

Page 862: ...surements Power vs Time ACPR RF Summary Spurious Emission Channel Spectrum Back ACPR Number of Carriers Back PN Setup PN Trigger No Trig GPS Ext Back PN Search Type Auto Manual Manual PN Offset Setup PN Setup Walsh Codes 64 128 Meas Speed Fast Norm Slow Slot Type Auto Active Idle Ext Trig Polarity Rising Falling Number of Carriers 1 Carrier BW MHz 1 23 1 24 1 25 Carrier BW MHz 1 23 1 24 1 25 Ch Sp...

Page 863: ... Table Modulation Summary CDP MAC CDP Data Back Over The Air Multipath Pilot Scan Back Pass Fail Mode Select Pass Fail Test Back Reset H I J CDP MAC CDP Units Relative Absolute Back Zoom Start 0 Zoom 16 32 64 CDP Data CDP Units Relative Absolute Back ООО Техэнком Контрольно измерительные приборы и оборудование www tehencom com ...

Page 864: ...x includes all of the EVDO standards Channel Use the Up Down arrow keys the keypad or the rotary knob to select a channel number for the selected signal standard The center of the channel is automatically tuned to the center frequency of the selected EVDO channel The Channel Editor dialog box indicates the selected signal standard The range of channels and the channel step size depend upon the sel...

Page 865: ...dB to 100 dB Press the Power Offset key enter the values and press the dB submenu key Auto Range Pressing this submenu key toggles between On and Off This function adjusts the reference level automatically when Auto Range is activated Adjust Range Pressing Adjust Range will trigger reference level detection once and also set Auto Range to Off The instrument will no longer automatically trigger ref...

Page 866: ...e is available Selecting Idle makes the Power vs Time display an idle slot if one is available Selecting Auto makes the Power vs Time show an Idle slot or an Active slot if no idle slot is available This setting also affects the type of power trigger that is used in a Spurious Emission Test Number of Carriers This submenu key sets the number of required channels This affects the ACPR and Spurious ...

Page 867: ... Applicable only when PN Type is GPS or External Manual PN Offset Press this submenu key to manually set the PN offset Use the arrow keys rotary knob or numeric keypad to choose an offset then press the rotary knob or the Enter key to select the value Editing this value automatically changes the PN Search Type to Manual The Manual PN Offset function is available only when the trigger selection is ...

Page 868: ...Pilot Codes Ec Io dB Tau Pilot Power Channel Power Pilot Dominance and Multipath Pass Fail Mode The first press of this submenu key puts the instrument into Pass Fail Mode The next press of the submenu key opens the Pass Fail Mode Menu on page 3 31 EVDO Summary Displays a summary of all of the EVDO related numerical measurements in a table format Save Measurement Opens a dialog box to name and sav...

Page 869: ...o Power ratio in dB of Pilot and MAC power to the data power in an idle slot Idle Activity Percentage of idle slots relative to total slots in the captured signal ACPR Pressing this submenu key displays the Adjacent Channel Power Ratio ACPR The instrument displays one or more main channels and two adjacent channels on each side of the main channel A data window below the channel measurement displa...

Page 870: ...s the rotary knob or the Enter key Or change the number of channels by pressing a number on the numeric keypad press the Enter submenu key and then press the Enter key The adjacent channels remain displayed Carrier BW MHz Press this submenu key to select a bandwidth of 1 23 1 24 or 1 25 MHz Back Returns to the RF Measurement Menus on page 3 26 Figure 3 22 EVDO ACPR Menu ACPR Number of Carriers Bac...

Page 871: ... in this view are Pilot and MAC Power dBm Freq Error Hz Rho Pilot Data Modulation Channel Power dBm Freq Error PPM Rho Overall1 Noise Floor dB The codes are color coded according to the following list Reserved Channels in White Inactive channels in Gray Reverse Activity RA in Red Active channels alternate between Orange and Yellow An additional press of the CDP submenu key opens the CDP MAC Menu o...

Page 872: ... is a number indicating how many codes are used by a particular user traffic Modulation Summary Pressing this submenu key displays a summary of all the modulation related numerical measurement results in a table format with rows for Pilot MAC Power Channel Power Rho Pilot Rho MAC Rho Data Rho Overall1 Rho Overall2 Data Modulation Noise Floor RMS Phase Err Freq Error and Tau Back Returns to the Mea...

Page 873: ... to change the zoom start index The CDP submenu key remains after pressing the rotary knob or the Enter key CDP Units Press this submenu key to toggle between Relative units in dB or Absolute units in dBm Select Relative to show CDP power values in dB relative to Pilot and MAC Power or Absolute to show power values in dBm Back Returns to the Demodulator Menu on page 3 28 Figure 3 25 EVDO CDP Menu ...

Page 874: ...ystem noise The numerical results that are displayed in this view are Ec Io dB and Tau for each path Channel Power and Multipath Power are displayed below the graph Back Returns to the Measurements Menu on page 3 25 Figure 3 27 EVDO Over The Air Menu Select Pass Fail Test This submenu key function allows the selection of a user defined file that specifies a list of measurements with pass fail crit...

Page 875: ...ker table in the CDP MAC view only The marker table indicates the values of all active markers All Markers Off Pressing this soft key turns OFF all markers Figure 3 29 EVDO Measurements Menu Sweep Single Continuous This submenu key toggles between continuous sweep and single sweep In single sweep mode the results of a sweep are displayed on the screen while the instrument awaits a trigger event to...

Page 876: ...EVDO measurement mode 3 18 Trace Menu This menu is not available in EVDO measurement mode 3 19 Limit Menu This menu is not available in EVDO measurement mode 3 20 Other Menus Preset File Mode and System are described in the instrument User Guide ООО Техэнком Контрольно измерительные приборы и оборудование www tehencom com ...

Page 877: ...3 34 PN 10580 00235 Rev D 3GPP2 MG ООО Техэнком Контрольно измерительные приборы и оборудование www tehencom com ...

Page 878: ... Warning Messages No trigger found This message is displayed if the PN trigger is setup for External or GPS and the software does not detect a trigger Most measurement results that depend on a trigger are then cleared is seen in the result area Short Code not found This message is displayed if no dominant PN short code is found in the input signal ООО Техэнком Контрольно измерительные приборы и об...

Page 879: ...A 2 PN 10580 00235 Rev D 3GPP2 MG ООО Техэнком Контрольно измерительные приборы и оборудование www tehencom com ...

Page 880: ... measurements 2 15 demodulator menu CDMA 2 26 EVDO 3 28 E Ec Io 2 17 3 18 EVDO measurement setup 3 2 EVDO measurements 3 16 EVDO modulation summary setup 3 11 EVDO signal analyzer 3 1 EVDO summary setup 3 15 F freq error 3 16 freq menu CDMA 2 20 EVDO 3 21 frequency error 2 16 G GPS setup 2 3 I idle or active activity 3 18 L limit test 2 13 limit test menu 2 28 links contact 1 3 M MAC CDP table set...

Page 881: ...me graph 3 18 power vs time setup 3 4 Q Q paging power 2 16 R RF measurements menu CDMA 2 25 EVDO 3 26 RF measurements setup CDMA 2 4 EVDO 3 3 RF summary 2 15 Rho 2 16 3 17 Rho data 3 17 Rho MAC 3 17 Rho Overall 1 and 2 3 17 Rho pilot 3 17 S safety symbols for safety Safety 2 in manuals Safety 1 on equipment Safety 1 setup menu CDMA 2 22 EVDO 3 23 spurious emission 2 15 spurious emission setup 2 5...

Page 882: ...Anritsu Company 490 Jarvis Drive Morgan Hill CA 95037 2809 P N 10000 00000 Revision Prelim Printed December 2012 ООО Техэнком Контрольно измерительные приборы и оборудование www tehencom com ...

Page 883: ...any 490 Jarvis Drive Morgan Hill CA 95037 2809 USA http www anritsu com Anritsu prints on recycled paper with vegetable soybean oil ink ООО Техэнком Контрольно измерительные приборы и оборудование www tehencom com ...

Page 884: ...bile Option 66 Option 67 Option 37 For some models RF Demod and OTA are combined as a single option WiMAX Fixed Mobile Option 885 Anritsu Company 490 Jarvis Drive Morgan Hill CA 95037 2809 USA http www anritsu com Part Number 10580 00236 Revision D Published December 2012 Copyright 2009 2012 Anritsu Company ООО Техэнком Контрольно измерительные приборы и оборудование www tehencom com ...

Page 885: ...property of Anritsu Company and any unauthorized use or disclosure of these drawings specifications and information is prohibited they shall not be reproduced copied or used in whole or in part as the basis for manufacture or sale of the equipment or software programs without the prior written consent of Anritsu Company UPDATES Updates if any can be downloaded from the Anritsu Website at http www ...

Page 886: ...own in the diagrams in this manual This indicates a prohibited operation The prohibited operation is indicated symbolically in or near the barred circle This indicates a compulsory safety precaution The required operation is indicated symbolically in or near the circle This indicates a warning or caution The contents are indicated symbolically in or near the triangle This indicates a note The cont...

Page 887: ...e internal components Only qualified service technicians with a knowledge of electrical fire and shock hazards should service this equipment There are high voltage parts in this equipment presenting a risk of severe injury or fatal electric shock to untrained personnel In addition there is a risk of damage to precision components Caution Electrostatic Discharge ESD can damage the highly sensitive ...

Page 888: ...3 2 4 Fixed WiMAX RF Measurements 2 4 Setup for Fixed WiMAX RF Measurements 2 4 Spectrum 2 4 Power versus Time 2 5 Adjacent Channel Power Ratio ACPR 2 6 RF Summary 2 7 2 5 Fixed WiMAX Demodulator 2 8 Setup for Fixed WiMAX Demodulator Measurements 2 8 Constellation 2 8 Spectral Flatness 2 10 EVM versus SubCarrier 2 11 EVM versus Symbol 2 12 Modulation Summary 2 13 Pass Fail Mode 2 14 WiMAX Summary ...

Page 889: ...Setup 3 3 Demod Type Setup 3 3 Span Setup 3 3 3 4 Mobile WiMAX RF Measurements 3 4 Setup for RF Measurements 3 4 Spectrum 3 4 Power versus Time 3 5 Adjacent Channel Power Ratio ACPR 3 6 RF Summary 3 7 3 5 Mobile WiMAX Demod Measurements 3 8 Setup for Demodulator Measurements 3 8 Constellation 3 8 Spectral Flatness 3 9 EVM versus Sub Carrier 3 10 EVM versus Symbol 3 11 Modulation Summary 3 12 DL MA...

Page 890: ...3 26 Demodulator Menu Continued 3 27 Over The Air Menu 3 28 Pass Fail Mode Menu 3 29 3 12 Marker Menu 3 30 3 13 Sweep Menu 3 30 3 14 Measure Menu 3 31 3 15 Trace Menu 3 31 3 16 Limit Menu 3 31 3 17 Other Menus 3 31 Appendix A Error Messages A 1 Introduction A 1 A 2 Common WiMAX Messages A 1 A 3 Fixed WiMAX Messages A 2 A 4 Mobile WiMAX Messages A 2 Index ООО Техэнком Контрольно измерительные прибо...

Page 891: ...Contents 4 PN 10580 00236 Rev D WiMAX MG Table of Contents Continued ООО Техэнком Контрольно измерительные приборы и оборудование www tehencom com ...

Page 892: ... WiMAX Mobile WiMAX signal analysis is described in Chapter 3 Mobile WiMAX Signal Analyzer Option 37 Mobile WiMAX Over the Air OTA Measurements Option 66 Mobile WiMAX RF Measurements Option 67 Mobile WiMAX Demodulator Option 0885 WiMAX Fixed Mobile Measurements requires Option 9 Instruments with these options can measure TDD Mobile WiMAX networks OTA RF and demodulator measurements require that an...

Page 893: ... box Highlight the desired measurement mode using the Up or Down arrow keys and press Enter Some Anritsu handheld instruments also have a Menu button which displays icons of installed measurement modes and allows measurement mode selection using the touch screen Refer to the instrument User Guide for additional information Figure 1 1 Mode Selector Dialog Box Figure 1 2 Mode Selector Dialog Box ООО...

Page 894: ...enna to the instrument RF In connector 2 2 Fixed WiMAX Measurements The following measurements can be made when the instrument is set to Fixed WiMAX mode Channel Power RSSI Channel power measures the average time domain power within the selected bandwidth and is expressed in dBm Received Signal Strength Indicator RSSI is vendor defined in the standard and is typically the same as Channel Power Occ...

Page 895: ...e Constellation Error RCE Relative Constellation Error is similar to EVM but is expressed in dB RCE 20 log EVM where EVM is expressed in 100 Both rms and peak values over an entire downlink subframe are displayed Carrier Frequency Carrier Frequency is the measured frequency of the input signal after demodulation and is the same as the tuned Center Frequency of the instrument plus the measured Freq...

Page 896: ...b to highlight the applicable ratio and press the Enter key to set the ratio The selected ratio is displayed in the user settable parameters to the left of the display Span Setup To set the span for Spectrum View 1 Press the Setup main menu key 2 Press the Span submenu key to display the available spans 5 MHz 10 MHz 20 MHZ 30 MHz 3 Use the Up Down arrow keys or the rotary knob to highlight the app...

Page 897: ...rame length and CP Ratio as described in the General Measurement Setups on page 2 3 Spectrum The Spectrum screen displays the spectrum of the input signal and of channel power in dBm and displays the occupied bandwidth in Hz Procedure 1 Setup the measurement as described in Setup for Fixed WiMAX RF Measurements on page 2 4 2 Press the Measurements main menu key 3 Press the RF submenu key 4 Press t...

Page 898: ...en also displays Channel Power RSSI Data Burst Power Preamble Power and Crest Factor Procedure 1 Setup the measurement as described in Setup for Fixed WiMAX RF Measurements on page 2 4 2 Press the Measurements main menu key 3 Press the RF submenu key 4 Press the Power vs Time submenu key to activate the measurement The sample image in Figure 2 2 may differ from any image on your instrument Figure ...

Page 899: ...e The channel spacing matches the selected bandwidth and the channels are color coded Procedure 1 Setup the measurement as described in Setup for Fixed WiMAX RF Measurements on page 2 4 2 Press the Measurements main menu key 3 Press the RF submenu key 4 Press the ACPR submenu key to activate the measurement The sample image in Figure 2 3 may differ from any image on your instrument Figure 2 3 ACPR...

Page 900: ...e Channel Power in dBm Data Burst power in dBm Preamble power in dBm Occupied Bandwidth and Crest Factor Procedure 1 Setup the measurement as described in Setup for Fixed WiMAX RF Measurements on page 2 4 2 Press the Measurements main menu key 3 Press the RF submenu key 4 Press the RF Summary submenu key to activate the measurement The sample image in Figure 2 4 may differ from any image on your i...

Page 901: ... color coded for modulation as follows BPSK is shown in orange QPSK is shown in purple 16QAM is shown in green 64QAM is shown in yellow The numerical results that are displayed in this view are RCE rms in dB RCE pk in dB EVM rms in EVM pk in Freq Error in Hz Freq Error in ppm Carrier Frequency in Hz and Base Station ID Procedure 1 Setup the measurement as described in Setup for Fixed WiMAX Demodul...

Page 902: ...iMAX Demodulator WiMAX MG PN 10580 00236 Rev D 2 9 The sample image in Figure 2 5 may differ from any image on your instrument Figure 2 5 Constellation View Demodulator Menu ООО Техэнком Контрольно измерительные приборы и оборудование www tehencom com ...

Page 903: ...ication for the mask is 0 to 50 subcarriers 2 dB 50 to 100 subcarriers 2 dB and 4 dB This mask is referenced from the average of all 200 subcarrier amplitude values The numerical result that is displayed in this view is the adjacent sub carrier flatness in dB Procedure 1 Setup the measurement as described in Setup for Fixed WiMAX Demodulator Measurements on page 2 8 2 Press the Measurements main m...

Page 904: ...CE pk in dB EVM rms in EVM pk in Freq Error in Hz Freq Error in ppm Carrier Frequency in Hz Base Station ID Procedure 1 Setup the measurement as described in Setup for Fixed WiMAX Demodulator Measurements on page 2 8 2 Press the Measurements main menu key 3 Press the Demodulator submenu key 4 Press the EVM vs SubCarrier submenu key to activate the measurement The sample image in Figure 2 7 may dif...

Page 905: ... Hz Freq Error in ppm Carrier Frequency in Hz Base Station ID Procedure 1 Setup the measurement as described in Setup for Fixed WiMAX Demodulator Measurements on page 2 8 2 Press the Measurements main menu key 3 Press the Demodulator submenu key 4 Press the EVM vs Symbol submenu key to activate the measurement The sample image in Figure 2 8 may differ from any image on your instrument Figure 2 8 E...

Page 906: ...CE pk in dB EVM rms in EVM pk in Freq Error in Hz Freq Error in ppm Carrier Frequency in Hz Base Station ID Procedure 1 Setup the measurement as described in Setup for Fixed WiMAX Demodulator Measurements on page 2 8 2 Press the Measurements main menu key 3 Press the Demodulator submenu key 4 Press the Modulation Summary submenu key to activate the measurement The sample image in Figure 2 9 may di...

Page 907: ... identification of Pass Fail results including minimum and maximum thresholds and measured results Procedure 1 Setup the measurement as described in Setup for Fixed WiMAX Demodulator Measurements on page 2 8 2 Press the Measurements main menu key 3 Press the Pass Fail Mode submenu key 4 Press the Pass Fail Mode submenu key again to activate the submenu 5 Press the Select Pass Fail Test submenu key...

Page 908: ...RF and Demodulation measurements Procedure 1 Setup the measurement as described in Setup for Fixed WiMAX Demodulator Measurements on page 2 8 2 Press the Measurements main menu key 3 Press the WiMAX Summary submenu key The sample image in Figure 2 11 may differ from any image on your instrument Figure 2 11 WiMAX Summary ООО Техэнком Контрольно измерительные приборы и оборудование www tehencom com ...

Page 909: ... div Frequency Center Freq 2 500 GHz Signal Standard Channel Decrement Channel Increment Channel Back Set CF To Closet Channel Auto Range On Off Reference Points Off On Setup CP Ratio G 1 4 Span 5 MHz BW 1 25 MHz Frame Length 2 5 ms 5 ms 10 ms Measurements Save Measurement Pass Fail Mode WiMAX Summary RF Measurements Demodulator Back RF Measurements Spectrum Power vs Time ACPR RF Summary Spectrum ...

Page 910: ...ted standard Other settings such as channel spacing and integration bandwidth are also automatically entered Channel Press this submenu key and use the Up Down arrow keys the keypad or the rotary knob to select a channel number for the selected Signal Standard The instrument measurement display is automatically tuned to the center frequency of the selected channel The listed channels are from 0 to...

Page 911: ...ed the reference level is automatically adjusted Press the Auto Range submenu key to switch between On and Off Adjust Range When Auto Range is set to the Off state press this submenu key to adjust the internal reference level to be optimal based on the measured signal The Range adjustment is performed once each time the submenu key is pressed When Auto Range is set to On pressing this submenu key ...

Page 912: ...tio is 1 4 Span Press this submenu key to select the desired Span for the Spectrum view by using the Up Down arrow keys or the rotary knob and then press Enter The available Span selections are 5 MHz 10 MHz 20 MHz or 30 MHz Note The span value is automatically adjusted to the next largest available span when the BW setting is changed The span can be changed to any of the listed values to override ...

Page 913: ...u on page 2 24 WiMAX Summary Displays a summary of all the WiMAX related numerical measurement results Channel Power RSSI in dBm Data Burst Power in dBm Preamble Power in dBm Occupied BW in Hz Crest Factor in dBm RCE rms in dB RCE pk in dB EVM rms in EVM pk in Carrier Frequency in Hz Freq Error in Hz Freq Error ppm Base Station ID Save Measurement Initiates a dialog box to name and save the curren...

Page 914: ...alues to override the automatic selection Back Returns to the RF Measurements menu Power vs Time The Power versus Time view shows the time domain view of a WiMAX 802 16 2004 OFDM signal over approximately one frame The Channel Power in dBm Preamble power in dBm burst power of data bursts in dBm and the Crest Factor are displayed as numerical values ACPR The ACPR Adjacent Channel Power Ratio view s...

Page 915: ...ator menu Spectral Flatness Press this submenu key to show the spectral flatness data that is measured from the preamble at the channel estimation step The deviation of the spectral flatness from the average of all the carriers is shown in dB A mask that conforms to the specification is overlaid on the trace Green color on the mask indicates pass and red color on the mask indicates regions of the ...

Page 916: ... this submenu key to display a summary table of all of the modulation related numerical measurement results RCE rms in dB RCE pk in dB EVM rms in EVM pk in Freq Error in Hz Freq Error ppm Carrier Frequency in Hz Base Station ID Back Press this submenu key to return to the Measurements Menu on page 2 20 Figure 2 19 Fixed WiMAX Demodulator Menu 2 of 2 Reference Points Off On Back Back Demodulator Co...

Page 917: ...20 Figure 2 20 Fixed WiMAX Pass Fail Mode Menu Sweep Single Continuous This submenu key toggles between continuous sweep and single sweep In single sweep mode the results of a sweep are displayed on the screen while the instrument awaits a trigger event to start a new sweep Trigger Sweep Pressing this submenu key causes the instrument to make a single sweep when the instrument is in single sweep m...

Page 918: ...key to toggle Max Hold On or Off It applies to Spectrum view and EVM vs Sub Carrier view This function allows the spectrum trace to hold its peak value from trace to trace This helps in capturing a representative spectrum of a burst RF signal such as WiMAX All Max Hold operations show two traces One trace is a max hold value and the other is a live trace with the current measurement results Figure...

Page 919: ...2 15 Other Menus Chapter 2 Fixed WiMAX Signal Analyzer 2 26 PN 10580 00236 Rev D WiMAX MG ООО Техэнком Контрольно измерительные приборы и оборудование www tehencom com ...

Page 920: ... in the span Downlink Burst Power Downlink Burst power is the RMS power over the downlink subframe of the WiMAX frame Uplink Burst Power Uplink Burst power is the RMS power over the uplink subframe of the WiMAX frame Preamble Power Preamble power is the RMS power over the preamble part of the downlink subframe Freq Error The difference between the received frequency and the specified frequency is ...

Page 921: ...the desired signal and the interference can either be noise or co channel interference or both In order for the signal receiver to be able to decode the signal the signal must fall into an acceptable CINR range PCINR Physical CINR is an estimate of C N I ratio on non boosted data sub carriers It is calculated by measuring the power of the sub carriers in the preamble where the sub carrier allocati...

Page 922: ... menu key 2 Press the Frame Length submenu key to toggle between 5 ms and 10 ms Demod Type Setup The instrument can demodulate the signal in three ways It can demodulate the signal by decoding the downlink map DL MAP It can demodulate the signal based upon manually entered parameters for the DL MAP by using an xml file DL MAP parameters can be defined by using the Anritsu IQProducer software and t...

Page 923: ...ct one of the following RF measurements Spectrum The Spectrum screen displays the spectrum of the input signal the channel power in dBm and occupied bandwidth 1 Press the Spectrum submenu key to select the spectrum measurement 2 Press the Spectrum submenu key again to open the Spectrum menu and change the Span if desired Span choices are 5 MHz 10 MHz 20 MHz and 30 MHz The sample image in Figure 3 ...

Page 924: ...l over approximately one frame The screen also displays Channel Power RSSI Downlink Burst Power Uplink Burst Power and Preamble Power The sample image in Figure 3 2 may differ from any image on your instrument Press the Power vs Time submenu key to select the measurement Figure 3 2 Mobile WiMAX Power versus Time Measurement ООО Техэнком Контрольно измерительные приборы и оборудование www tehencom ...

Page 925: ...ls total This view also displays the power levels for each channel both absolute and relative The channel spacing matches the selected bandwidth and the channels are color coded The sample image in Figure 3 3 may differ from any image on your instrument Press the ACPR submenu key to select the measurement Figure 3 3 Mobile WiMAX ACPR Measurement ООО Техэнком Контрольно измерительные приборы и обор...

Page 926: ...ing the WiMAX signal The parameters that are displayed in the RF Summary table are Channel Power dBm Downlink Burst Power dBm Uplink Burst Power dBm Preamble Power dBm and Occupied Bandwidth Hz The sample image in Figure 3 4 may differ from any image on your instrument Press the RF Summary submenu key to activate the measurement Figure 3 4 Mobile WiMAX RF Summary ООО Техэнком Контрольно измеритель...

Page 927: ...ys the constellation of the demodulated data symbols over one frame The various constellations are color coded as follows QPSK is shown in purple 16QAM is shown in green 64QAM is shown in yellow The numerical results that are displayed in this view are RCE rms in dB RCE pk in dB EVM rms in EVM pk in Freq Error in Hz CINR Base Station ID and Sector ID The sample image in Figure 3 5 may differ from ...

Page 928: ... on the trace Green color on the mask indicates pass and red color on the mask indicates regions of the mask where the signal fails This mask is referenced from the average of all subcarrier amplitude values The numerical result that is displayed in this view is the adjacent subcarrier flatness in dB Press the Spectral Flatness submenu key to select the measurement The sample image in Figure 3 6 m...

Page 929: ...are displayed in this view are RCE rms in dB RCE pk in dB EVM rms in EVM pk in Freq Error in Hz CINR Base Station ID and Sector ID The sample image in Figure 3 7 may differ from any image on your instrument Press the EVM vs Sub Carrier submenu key to select the measurement Figure 3 7 Mobile WiMAX Demodulator EVM versus Sub Carrier Measurement ООО Техэнком Контрольно измерительные приборы и оборудо...

Page 930: ...layed in this view are RCE rms in dB RCE pk in dB EVM rms in EVM pk in Freq Error in Hz Freq Error ppm Carrier Frequency Hz and Sector ID The sample image in Figure 3 8 may differ from any image on your instrument Press the EVM vs Symbol submenu key to select the measurement Figure 3 8 Mobile WiMAX Demodulator EVM versus Symbol Measurement ООО Техэнком Контрольно измерительные приборы и оборудован...

Page 931: ...iMAX signal The parameters that are displayed in the Modulation summary table are RCE rms in dB RCE pk in dB EVM rms in EVM pk in Freq Error in Hz CINR Carrier Frequency Hz and Sector ID The sample image in Figure 3 9 may differ from any image on your instrument Press the Modulation Summary submenu key to select the measurement Figure 3 9 Mobile WiMAX Demodulator Modulation Summary Measurement ООО...

Page 932: ...e The xml parameter file is uploaded to the instrument with Master Software Tools 1 Press the DL MAP submenu key to open the DL MAP Tree which displays a list of WiMAX parameters 2 Use the Up Down and Left Right arrow keys to close or to open subordinate lists within the map The sample image in Figure 3 10 may differ from any image on your instrument Figure 3 10 Mobile WiMAX Demodulator DL MAP Mea...

Page 933: ...so specify the time interval between channel power measurements Time stamps are recorded along with the power information If GPS is activated on the instrument then UTC time is stored and GPS coordinates are also stored If GPS is not activated on the instrument then the internal clock is used 1 Press the Channel Power Monitor submenu key to select the Channel Power Monitor 2 Set the Measurement In...

Page 934: ...reamble signal The PCINR calculated from all six preambles and the Base Station ID of the strongest preamble signal are listed below the table 1 Press the Preamble Scanner submenu key 2 Set the Auto Save submenu key turn as desired 3 Press the Reset Restart Measurement submenu key to discard logged Preamble data and restart logging of the data Figure 3 12 Mobile WiMAX OTA Preamble Scanner Measurem...

Page 935: ... in a table format with clear identification of Pass Fail results including minimum and maximum thresholds and measured results The sample image in Figure 3 13 may differ from any image on your instrument 1 Press the Measurements main menu key 2 Press the Pass Fail Mode submenu key 3 Press the Pass Fail Mode submenu key again to activate the Pass Fail Mode menu 4 Press the Select Pass Fail Test su...

Page 936: ...n dBm Preamble Power in dBm Occupied BW in Hz Uplink Burst Power in dBm RCE rms in dB RCE pk in dB EVM rms in EVM pk in Carrier Frequency in Hz Freq Error in Hz CINR Base Station ID and Sector ID 1 Press the Measurements main menu key 2 Press the WiMAX Summary submenu key The sample image in Figure 3 14 may differ from any image on your instrument Figure 3 14 Mobile WiMAX OTA WiMAX Summary Measure...

Page 937: ...nel Set CF To Closet Channel Auto Range On Off Setup CP Ratio G 1 8 Span 10 MHz Load Param File BW 1 25 MHz Setup 2 Frame Length 5ns 10ms Freq Error Hz ppm More Options Demod Auto Man FCH Back Marker Marker 1 2 3 4 5 6 On Off Gated Power On Off Delta On Off All Markers Off Span 5 MHz Back Reference Points Off On Measurements Save Measurement Pass Fail Mode WiMAX Summary RF Measurements Demodulator...

Page 938: ...19 Figure 3 16 Mobile WiMAX Menus 2 of 2 Channel Power Monitor Preamble Scanner Back Pass Fail Mode Reset Select Pass Fail Test Back Auto Save On Off Measurement Interval 1 s Reset Restart Measurement G H Over The Air ООО Техэнком Контрольно измерительные приборы и оборудование www tehencom com ...

Page 939: ...nd integration bandwidth are also automatically entered The applicable signal standards for 10 MHz BW only are U NII middle U NII upper CEPT band B and CEPT band C Channel Press this submenu key and use the Up Down arrow keys the keypad or the rotary knob to select a channel number for the selected Signal Standard The instrument measurement display is automatically tuned to the center frequency of...

Page 940: ...omatically adjusted automatic gain ranging Adjust Range When Auto Range is set to the OFF state press this submenu key to adjust the internal reference level to be optimal based on the measured signal The Range adjustment is performed once each time the submenu key is pressed When Auto Range is set to On pressing this submenu key causes Auto Range to be set to Off Note When the Adjust Range submen...

Page 941: ...anual and Frame Control Header Auto Man FCH When Auto is chosen the instrument attempts to demodulate the signal decode the DL MAP and use that information to demodulate the data portion of the frame When Manual is chosen a parameter file must be available you must have already loaded this parameter file The parameters from this file are used by the instrument to demodulate the data bursts Note Th...

Page 942: ...no trigger and an external trigger The current setting is underlined on the submenu key face Trigger Polarity Rising Falling Press this submenu key to toggle between a Rising or Falling trigger polarity The current setting is underlined on the submenu key face Back Press this submenu key to return to the Setup Menu on page 3 22 Figure 3 20 Mobile WiMAX Setup 2 Menu Setup 2 Freq Error Hz ppm Back T...

Page 943: ...fail testing The results are displayed in table format with clear identification of pass fail results including minimum and maximum thresholds and measured results WiMAX Summary Press this submenu key to display a summary of all of the WiMAX related numerical measurement results Channel power dBm Downlink Burst Power Preamble Power Occupied Bandwidth Uplink Burst Power RCE rms RCE pk EVM rms EVM p...

Page 944: ...ck Press this submenu key to return to the RF Measurements menu Power vs Time Press this submenu key to show the time domain view of a WiMAX 802 16 2004 OFDM signal over approximately one frame The Channel Power RSSI in dBm Preamble Power in dBm Downlink Burst Power in dBm and Uplink Burst Power are displayed as numerical values ACPR Press this submenu key to show one main channel and two adjacent...

Page 945: ...he default state Back Press this submenu key to return to the Demodulator menu Spectral Flatness Press this submenu key to show the spectral flatness data that is measured from the preamble at the channel estimation step The deviation of the spectral flatness from the average of all the carriers is shown in dB A mask that conforms to the specification is overlaid on the trace Green color on the ma...

Page 946: ...esults The following measurements are displayed RCE rms RCE pk EVM rms EVM pk Carrier Frequency Freq Error CINR Base Station ID Sector ID DL MAP Parameter Tree Press this submenu key to display the DL MAP information in Auto mode from the decoded results or in Manual mode from the parsed information which is from the xml parameter file Back Press this submenu key to return to the Measurements Menu...

Page 947: ...ress this key to toggle between On and Off When the Auto Save function is On measurements are automatically saved to file When the Auto Save function is active each 551 data points are saved as a measurement The amount of available memory in the instrument determines how many measurements can be saved If the Measurement Interval is set to values that will require more memory than is available then...

Page 948: ...ts The default list is PASS_FAIL_RF PASS_FAIL_DEMOD PASS_FAIL_ALL You can create a user defined file by using Master Software Tools Refer to Pass Fail Mode on page 3 16 Reset Press this submenu key to restart a Pass Fail test Back Press this submenu key to return to the Measurements Menu on page 3 24 Figure 3 26 Mobile WiMAX Pass Fail Menu Back Pass Fail Mode Reset Select Pass Fail Test ООО Техэнк...

Page 949: ...o read offsets in time and power by using the rotary knob or by entering a time offset using the number keypad Gated Power On Off Press this submenu key to turn Gated Power On and Off All Markers Off Press this submenu key to turn Off all markers and remove them from the display Figure 3 27 Mobile WiMAX Marker Menu Sweep Single Continuous This submenu key toggles between continuous sweep and singl...

Page 950: ...r Guide Max Hold Press this submenu key to toggle Max Hold On or Off It applies to Spectrum view and EVM vs Sub Carrier view This function allows the spectrum trace to hold its peak value from trace to trace This helps in capturing a representative spectrum of a burst RF signal such as WiMAX All Max Hold operations show two traces One trace is a max hold value and the other is a live trace with th...

Page 951: ...3 17 Other Menus Chapter 3 Mobile WiMAX Signal Analyzer 3 32 PN 10580 00236 Rev D WiMAX MG ООО Техэнком Контрольно измерительные приборы и оборудование www tehencom com ...

Page 952: ...ure xx When there is a lock failure detected from any of the internal LOs this message is displayed The xx is usually an error code in hex that can be interpreted by a service center to obtain more information on which LO had the failure ADC over range When the software detects that the internal ADC is being overloaded this message is displayed depending upon the gain settings either a decrease in...

Page 953: ...he long preamble FCH decoder failed This message is displayed when there is an error detected in the FCH decoder that is used to determine the base station ID A 4 Mobile WiMAX Messages DL Short Preamble not found When the software does not detect a Downlink short preamble in the burst this message is displayed on the screen All demodulation measurement results are cleared is seen in the result are...

Page 954: ...icates that the encoding type is not Convolutional Coding CC then this message is displayed because the instrument supports only Convolutional Coding at this time Too many symbols in DL MAP When the number of symbols exceeds the maximum number that is supported by the instrument then this message is displayed ООО Техэнком Контрольно измерительные приборы и оборудование www tehencom com ...

Page 955: ...A 4 Mobile WiMAX Messages Appendix A Error Messages A 4 PN 10580 00236 Rev D WiMAX MG ООО Техэнком Контрольно измерительные приборы и оборудование www tehencom com ...

Page 956: ...bile WiMAX 3 11 F fixed WiMAX measurements 2 1 fixed WiMAX options 1 1 frame length setup fixed WiMAX 2 3 mobile WiMAX 3 3 freq error 2 2 3 1 I input level without damage 1 1 2 1 3 1 M maximum input to RF In 1 1 2 1 3 1 measurement mode selection 1 2 measurements ACPR fixed WiMAX 2 6 mobile WiMAX 3 6 bandwidth setup mobile WiMAX 3 3 channel power monitor mobile WiMAX 3 14 constellation fixed WiMAX...

Page 957: ... WiMAX 2 13 mobile WiMAX 3 12 O occupied BW 3 1 options for WiMAX 1 1 OTA 3 14 out of band saturation error A 1 over the air 3 14 P pass fail mode fixed WiMAX 2 14 mobile WiMAX 3 16 power vs time fixed WiMAX 2 5 mobile WiMAX 3 5 preamble power 2 1 3 1 R relative constellation error RCE 2 2 3 2 RF In port max input 1 1 2 1 3 1 RF measurements fixed WiMAX 2 4 mobile WiMAX 3 4 RF summary fixed WiMAX ...

Page 958: ...Anritsu Company 490 Jarvis Drive Morgan Hill CA 95037 2809 P N 10000 00000 Revision Prelim Printed December 2012 ООО Техэнком Контрольно измерительные приборы и оборудование www tehencom com ...

Page 959: ...any 490 Jarvis Drive Morgan Hill CA 95037 2809 USA http www anritsu com Anritsu prints on recycled paper with vegetable soybean oil ink ООО Техэнком Контрольно измерительные приборы и оборудование www tehencom com ...

Page 960: ...es Tracking Generator Option 20 Tracking Generator Option 809 Option 813 Option 820 Anritsu Company 490 Jarvis Drive Morgan Hill CA 95037 2809 USA http www anritsu com Part Number 10580 00339 Revision C Published December 2012 Copyright 2012 Anritsu Company ООО Техэнком Контрольно измерительные приборы и оборудование www tehencom com ...

Page 961: ...Company and any unauthorized use or disclosure of these drawings specifications and information is prohibited they shall not be reproduced copied or used in whole or in part as the basis for manufacture or sale of the equipment or software programs without the prior written consent of Anritsu Company UPDATES Updates if any can be downloaded from the Anritsu Website at http www anritsu com For the ...

Page 962: ... very dangerous condition or procedure that could result in serious injury or death and possible loss related to equipment malfunction Follow all precautions and procedures to minimize this risk Warning This indicates a risk from a hazardous condition or procedure that could result in light to severe injury or loss related to equipment malfunction Follow all precautions and procedures to minimize ...

Page 963: ...vere injury or fatal electric shock to untrained personnel In addition there is a risk of damage to precision components Caution Electrostatic Discharge ESD can damage the highly sensitive circuits in the instrument ESD is most likely to occur as test devices are being connected to or disconnected from the instrument s front and rear panel ports and connectors You can protect the instrument and te...

Page 964: ...ssion Measurements 2 6 2 5 CW Generator Overview 2 8 2 6 Tracking Generator Menus 2 10 2 7 Generator Menu 2 11 Settings Menu 2 12 Transmission Measurement Menu 2 13 Chapter 3 T Series Tracking Generator 3 1 Generator Mode 3 1 3 2 Tracking Generator Overview 3 1 3 3 Measurement Example 3 2 3 4 Transmission Measurements 3 4 3 5 CW Generator Overview 3 6 3 6 Tracking Generator Menus 3 8 3 7 Generator...

Page 965: ...Contents 2 PN 10580 00339 Rev C Tracking Generator MG ООО Техэнком Контрольно измерительные приборы и оборудование www tehencom com ...

Page 966: ...nly specific Tracking Generator functions The tracking generator and spectrum analyzer combination allows a signal to be applied to a device under test DUT to measure the frequency response General Spectrum Analyzer measurement functions including Frequency Amplitude Span Bandwidth Marker Sweep Trace and Limit menus are detailed in the Spectrum Analyzer Measurement Guides SPA MG available on the A...

Page 967: ... web site http www anritsu com Search for the product model number The latest documentation is on the product page under the Library tab 1 3 Selecting Tracking Generator Press the Menu button and select the Tracking Generator measurement shortcut by tapping on the touch screen Figure 1 1 You can also press the Shift key then the Mode 9 key select Spectrum Analyzer Figure 1 2 from the list using th...

Page 968: ...Measurement Mode List example Figure 1 3 Tracking and CW Generator Options Refer to Instrument s Spectrum Analyzer Measurement Guide Refer to Chapter 2 Option 20 or Chapter 3 Options 809 813 820 Tracking Generator and CW Generator accessed here All Measurements Off Measure Power and Bandwidth Masks and C I AM FM Demod Generator Coverage Mapping Refer to Instrument s Spectrum Analyzer Measurement G...

Page 969: ...1 3 Selecting Tracking Generator Chapter 1 General Information 1 4 PN 10580 00339 Rev C Tracking Generator MG ООО Техэнком Контрольно измерительные приборы и оборудование www tehencom com ...

Page 970: ...is chapter 2 2 Tracking Generator Overview 1 Set the Mode to Spectrum Analyzer Refer to Chapter 1 for details 2 Preset the instrument Shift 1 Preset 3 Set the spectrum analyzer frequency range using the Frequency Freq menu and submenus Refer to the Spectrum Analyzer Measurement Guide 10580 00244 for additional information 4 Press the Shift key then the Measure 4 key Press the Generator key 5 Press...

Page 971: ... shown in Figure 2 1 on page 2 2 For connector torque and connector care information refer to the User Guide for your instrument 4 Toggle the Generator Output to On Note Turning the Tracking Generator On sets the detection type Amplitude Detection to Sample and sets the sweep mode Sweep Sweep Mode to No FFT Turning off the generator resets both parameters to their previous settings Either paramete...

Page 972: ... Average A submenu key to turn on averaging and clean up the stop band area An averaging value of 10 will probably be adequate for most filters 8 Under the Setting submenu turn Power Statistics On Figure 2 2 to display the spectrum analyzer received Maximum Average and Minimum power of each frequency range sweep Note If the noise floor drops below the visible display then set the Scale dB division...

Page 973: ...strument calibrates across the frequency range reducing any output ripple After the successful completion the Accy label will be displayed after the Generator output power Figure 2 5 on page 2 6 5 Figure 2 4 on page 2 5 is a detail of the top of the filter trace shown in Figure 2 2 before calibration Figure 2 5 shows the same trace section after enhanced calibration using two 3 dB pads The 7 5 dB ...

Page 974: ...r 2 3 Measurement Example Tracking Generator MG PN 10580 00339 Rev C 2 5 Figure 2 3 Enhanced Generator Accuracy Figure 2 4 Before Enhanced Accuracy Calibration ООО Техэнком Контрольно измерительные приборы и оборудование www tehencom com ...

Page 975: ...s ON If desired the resolution bandwidth and video bandwidth can be changed after normalization without needing to renormalize After the normalization sweep is completed reconnect the DUT between the GENERATOR RF OUT and ANALYZER RF In connectors Figure 2 7 shows the filter measurement after normalization Displaying the trace required changing the Relative Ref top of the graticule and the Relative...

Page 976: ...2 4 Transmission Measurements Tracking Generator MG PN 10580 00339 Rev C 2 7 Figure 2 6 Normalized Through Cable Trace at 0 dB Figure 2 7 Normalized Filter Trace ООО Техэнком Контрольно измерительные приборы и оборудование www tehencom com ...

Page 977: ...fer to Chapter 1 for details 3 Preset the instrument Shift 1 Preset 4 Set the spectrum analyzer frequency range using the Frequency Freq menu and submenus Refer to the Spectrum Analyzer Measurement Guide 10580 00244 for additional information 5 Press the Shift key then the Measure 4 key Press the Generator key 6 Press the Output Power button and set the output power at the output connector before ...

Page 978: ...onal information Note Confirm that the CW Frequency is set within the spectrum analyzer span or the signal will not be displayed on the instrument Note Turning the CW Generator On sets the detection type Amplitude Detection to Peak and sets the sweep mode Sweep Sweep Mode to Performance Turning off the generator resets both parameters to their previous settings Either parameter may be changed by t...

Page 979: ... Guide p n 10580 00244 General instrument operating functions including the Preset File Mode and System are described in the instrument User Guide Generator Output Power 50 dBm CW Frequency 1 000 GHz Generator Output On Off Generator Mode CW Tracking Refer to 10580 00244 Spectrum Analyzer Measurement Guide All Measurements Off Measure Power and Bandwidth Masks and C I AM FM Demod Generator Coverag...

Page 980: ...output frequency is fixed and set by the CW Frequency submenu In Tracking Mode the output frequency is paired with the spectrum analyzer input sweeping frequency The frequency range is set using the Freq main menu and submenu keys Setting Generator Mode to Tracking will automatically set Sweep Mode to NO FFT and Detection to Sample CW Frequency Sets the frequency of the output when the Generator M...

Page 981: ...ys the Gen Power Accuracy submenu Enhanced Accuracy Calibration Improves the output accuracy of the generator when turned on The calibration can be done in both Tracking Generator and CW Generator modes Changing the output power turns enhanced calibration OFF Accy is displayed after the Generator power level when Enhanced Accuracy is ON Matching Pads 3dB Zero One Two Sets the number of external 3 ...

Page 982: ... to set the value of the top graticule line in dB relative to the THROUGH connection that was made when normalization was performed Relative Scale Press to set the scale factor from 1 dB division to 15 dB division in 1 dB steps Transmission Statistics Press to display the Transmission Measurement Statistics table displaying the received spectrum analyzer Maximum Average and Minimum relative power ...

Page 983: ...2 7 Generator Menu Chapter 2 E Series Tracking Generator 2 14 PN 10580 00339 Rev C Tracking Generator MG ООО Техэнком Контрольно измерительные приборы и оборудование www tehencom com ...

Page 984: ...fer to the Spectrum Analyzer Measurement Guide 10580 00349 for additional information 4 Press the Shift key then the Measure 4 key Press the Generator key 5 Press the Output Power button and set the output power at the output connector before any external attenuation In tracking mode the output is leveled and flat over the spectrum analyzer frequency range 6 Set the Generator Mode to Tracking In T...

Page 985: ...n page 3 2 For connector torque and connector care information refer to the User Guide for your instrument 4 Toggle the Generator Output to On 5 Observe the measurement to confirm that the pass band frequency range covers the required span 6 If the spectrum analyzer noise floor is too high for the necessary measurements then reduce the input attenuation and RBW to maximize the dynamic range Figure...

Page 986: ...re 3 2 to display the spectrum analyzer received Maximum Average and Minimum power of each frequency range sweep Note If the noise floor drops below the visible display then set the Scale dB division setting to a value larger than 10 This will increase the displayed amplitude range Figure 3 2 Increasing Measurement Dynamic Range Trace Averaging On Displaying Power Statistics Note Many of displayed...

Page 987: ... key then the Measure 4 key Press the Generator key Set the Generator Mode to Tracking and turn Generator Output On 3 Connect a through cable between the RF OUT and RF In connectors From the Generator submenu press the Transmission Measurement submenu key Figure 3 3 4 Toggle Normalize On Figure 3 4 A message will flash when the process is complete Figure 3 3 Normalize Off Trace at 0 dBm Figure 3 4...

Page 988: ...ct the DUT between the RF OUT and RF In connectors Figure 3 5 shows a filter measurement after the normalization process Displaying the trace required changing the Reference Position to 9 and the Scale db range between grids Refer to Transmission Measurement Menu on page 3 11 for additional information including Transmission Statistics and Transmission Offset Note Set the appropriate input attenua...

Page 989: ...efer to Chapter 1 for details 3 Preset the instrument Shift 1 Preset 4 Set the spectrum analyzer frequency range using the Frequency Freq menu and submenus Refer to the Spectrum Analyzer Measurement Guide 10580 00349 for additional information 5 Press the Shift key then the Measure 4 key Press the Generator key 6 Press the Output Power button and set the output power at the output connector before...

Page 990: ...vel that has been set previously with the Output Power key 9 Figure 3 7 displays the CW output at 1 GHz frequency and 0 0 dBm power Refer to Generator Menu on page 3 9 for additional information Note Confirm that the CW Frequency is set within the spectrum analyzer span or the signal will not be displayed on the instrument Figure 3 7 CW Output Example ООО Техэнком Контрольно измерительные приборы ...

Page 991: ... Trace and Limit menus are detailed in the Spectrum Analyzer Measurement Guide p n 10580 00349 General instrument operating functions including the Preset File Mode and System are described in the instrument User Guide Generator Output Power 50 dBm CW Frequency 1 000 GHz Generator Output On Off Generator Mode CW Tracking Refer to 10580 00349 Spectrum Analyzer Measurement Guide All Measurements Off...

Page 992: ...ss to toggle the Generator Mode between CW and Tracking In CW Mode the output frequency is fixed and set by the CW Frequency submenu In Tracking Mode the output frequency is paired with the spectrum analyzer input sweeping frequency The frequency range is set using the Freq main menu and submenu keys CW Frequency Sets the frequency of the output when the Generator Mode is set to CW Settings Displa...

Page 993: ...ator output power level displayed in the upper right corner Regardless of the external gain or loss setting the output power range of the tracking generator will not change Power Statistics Press to display the Tracking Generator Summary table displaying the spectrum analyzer received Maximum Average and Minimum power of each frequency range sweep Only available with Generator Mode set to tracking...

Page 994: ...sition of the Reference Amplitude A setting of 5 uses the middle grid line Position indicated by the symbol Reference Amplitude Press to set the reference amplitude The Reference Amplitude value is placed at the defined Reference Position and the displayed amplitude values are adjusted based on the Scale division Transmission Statistics Press to display the Transmission Measurement Statistics tabl...

Page 995: ...3 7 Generator Menu Chapter 3 T Series Tracking Generator 3 12 PN 10580 00339 Rev C Tracking Generator MG ООО Техэнком Контрольно измерительные приборы и оборудование www tehencom com ...

Page 996: ... 2 12 generator with TG 20 2 11 generator with TG 800 3 9 measure with TG 20 2 10 measure with TG 800 3 8 settings with TG 20 2 12 settings with TG 800 3 10 transmission with TG 20 2 13 transmission with TG 800 3 11 Menu button 1 2 menu map TG 20 menus 2 10 TG 800 menus 3 8 mode change 1 2 N normalization scale 2 13 3 11 Normalize 2 13 3 11 normalized reference level 2 13 3 11 R relative scale exa...

Page 997: ... 00339 Rev C Tracking Generator MG tuning frequency TG 800 3 1 tuning frequency TG 20 2 1 W warning battery storage Safety 2 web links contact 1 2 ООО Техэнком Контрольно измерительные приборы и оборудование www tehencom com ...

Page 998: ...Anritsu Company 490 Jarvis Drive Morgan Hill CA 95037 2809 P N 10000 00000 Revision Prelim Printed December 2012 ООО Техэнком Контрольно измерительные приборы и оборудование www tehencom com ...

Page 999: ...any 490 Jarvis Drive Morgan Hill CA 95037 2809 USA http www anritsu com Anritsu prints on recycled paper with vegetable soybean oil ink ООО Техэнком Контрольно измерительные приборы и оборудование www tehencom com ...

Page 1000: ...ter Cell Master Измеритель мощности Опция 29 Прецизионный измеритель мощности Опция 19 Anritsu Company 490 Jarvis Drive Morgan Hill CA 95037 2809 USA Шифр компонента 10580 00240 Редакция В Опубликовано август 2009 Copyright 2009 Anritsu Company ООО Техэнком Контрольно измерительные приборы и оборудование www tehencom com ...

Page 1001: ...itsu Все рисунки спецификации и информация содержащиеся в данном руководстве являются собственностью компании Anritsu и любое несанкционированное использование или распространение данных рисунков спецификаций и информации запрещено запрещается их полное или частичное воспроизведение или копирование или использование в целях производства или продажи оборудования или программного обеспечения без пре...

Page 1002: ...анные предупреждающие символы используются внутри или на оборудовании рядом с местом эксплуатации и предоставляют информацию о необходимых мерах безопасности и предосторожности Важно чтобы пользователь четко понимал значения символов и предпринимал необходимые меры предосторожности до того как он приступит к работе с оборудованием Указанные символы не обязательно будут использоваться на всем обору...

Page 1003: ...ра должно проводиться только квалифицированным обслуживающим персоналом Прибор содержит компоненты находящиеся под высоким напряжением работа с которыми может привести к серьезному поражению электрическим током если она выполняется необученным специалистом Кроме того существует опасность повреждения прецизионных частей Внимание Электростатический разряд может стать причиной повреждения высокочувст...

Page 1004: ...а 2 7 Меню Units Единицы 2 8 2 6 Меню Average среднее 2 9 2 7 Меню Limit Ограничение 2 9 2 8 Меню Sweep Развертка 2 9 2 9 Меню Measure Измерение 2 10 2 10 Меню Trace Траектория 2 10 2 11 Другие меню 2 10 Глава 3 Прецизионный измеритель мощности 3 1 3 1 Введение 3 1 3 2 Требуемое оборудование 3 1 3 3 Общие настройки для измерения 3 2 Изменение единиц отображения 3 2 Обнуление и калибровка 3 2 Измен...

Page 1005: ... 3 10 Меню Measure Измерение 3 9 3 11 Меню Trace Траектория 3 9 3 12 Другие меню 3 9 Приложение А Сообщения об ошибках 1 А 1 Введение А 1 A 2 Сообщения об ошибках в режиме прецизионного измерителя мощности А 1 Приложение Б Датчики мощности для Опции 19 Б 1 Б 1 Введение Б 1 Указатель Содержание 2 Шифр 10580 00240 Ред В Измеритель мощности РИ ООО Техэнком Контрольно измерительные приборы и оборудова...

Page 1006: ...ри этом внешние датчики не требуются 1 3 Прецизионный измеритель мощности Приборы с установленной Опцией 19 и соответствующим датчиком могут использоваться для выполнения прецизионных измерений мощности Данная опция обеспечивает выполнение истинных среднеквадратичных измерений с высокой точностью как для непрерывных сигналов CW так и для комплексных сигналов модулированных цифровым сигналом Датчик...

Page 1007: ...1 2 Шифр 10580 00231 Ред В Измеритель мощности РИ ООО Техэнком Контрольно измерительные приборы и оборудование www tehencom com ...

Page 1008: ... измерения Более подробно о выборе режима измерителя мощности Power Meter и управлении файлами см в Руководстве пользователя вашего прибора Настройка частотного диапазона Для настройки прибора на требуемую частоту нажмите клавишу главного меню Freq Выберите режим настройки параметров частоты ручной или выбор стандарта сигнала Ручной режим С помощью соответствующих клавиш введите начальную и конечн...

Page 1009: ...ражается в дБ Примечание Изображения экранов Рис 2 1 и Рис 2 2 приводятся в качестве примеров Реальные изображения и информация об измерениях выводимые на экране вашего прибора могут отличаться от примеров приведенных в данном руководстве Настройка ограничений 1 На приборе нажмите клавишу главного меню Limit или нажмите клавишу Shift а затем клавишу Limit 6 2 Нажмите клавишу подменю Upper Limit и ...

Page 1010: ...ния удовлетворяют установленным требованиям Если величина измеренной мощности находится за пределами ограничений то результаты измерения отображаются красным цветом Рис 2 2 Экран в режиме измерителя мощности результаты измерения не удовлетворяют установленным требованиям Анализатор спектра РИ Шифр 10580 00231 Ред В 2 3 ООО Техэнком Контрольно измерительные приборы и оборудование www tehencom com ...

Page 1011: ...делах дается описание главных меню и связанных с ними подменю Подменю перечисляются в том порядке в котором они появляются на экране сверху вниз под каждым главным меню Рис 2 3 Меню режима измерителя мощности 2 4 Шифр 10580 00240 Ред В Измеритель мощности РИ ООО Техэнком Контрольно измерительные приборы и оборудование www tehencom com ...

Page 1012: ...частоты начальная частота будет изменена таким образом чтобы она была на 1 кГц меньше конечной минимальная полоса обзора Span Открывает Меню Span Полоса обзора на стр 2 6 Freq Step Устанавливает интервал для использования при работе с клавишами со стрелками Введите размер шага с помощью клавиатуры клавиши со стрелками или вращающейся ручки Signal Standard Открывает меню стандартов сигнала с отобра...

Page 1013: ...воляет восстановить предыдущее значение полосы обзора Span Up 1 2 5 Увеличение полосы обзора до ближайшего целого числа начинающегося с 1 2 или 5 Span Down 1 2 5 Уменьшение полосы обзора до ближайшего целого числа начинающегося с 1 2 или 5 Full Span Устанавливает полосу обзора на 100 МГц на текущей центральной частоте Корректирует центральную частоту если она находится рядом с ограничением Min Spa...

Page 1014: ...оказывает относительный уровень желаемого базового уровня мощности на входе в прибор Во включенном состоянии On в области для сообщений отображается Relative On nnn dB где nnn dB текущее относительное значение При необходимости единицы автоматически переключаются в дБм Units Открывает Меню Units Единицы на стр 2 8 Внимание изменение единиц переводит Relative в выключенное состояние Off Autoscale Р...

Page 1015: ...ерителя мощности dmB dBV dBmV dbµV Volt или Watt Выбранная единица помечается красным кружком Back Возврат в Меню Amplitude Амплитуда на стр 2 7 Рис 2 7 Меню Units в режиме измерителя мощности 2 8 Шифр 10580 00240 Ред В Измеритель мощности РИ ООО Техэнком Контрольно измерительные приборы и оборудование www tehencom com ...

Page 1016: ...r Limit Ввод верхнего ограничения Введите необходимое значение с помощью клавиатуры клавиши со стрелками или вращающейся ручки Если для ввода использовалась клавиатура то нажатие Esc позволяет восстановить предыдущую настройку а нажатие Enter принять новую настройку Lower Limit Ввод нижнего ограничения Введите необходимое значение с помощью клавиатуры клавиши со стрелками или вращающейся ручки Есл...

Page 1017: ...ти 2 10 Меню Trace Траектория Данное меню не доступно в режиме измерителя мощности 2 11 Другие меню Описание меню Preset File Mode и System см в Руководстве пользователя 2 10 Шифр 10580 00240 Ред В Измеритель мощности РИ ООО Техэнком Контрольно измерительные приборы и оборудование www tehencom com ...

Page 1018: ...граничения чтобы увидеть находятся ли результаты измерения в пределах указанных ограничений или выходят за установленные ограничения Также в этом режиме доступны функции скользящего среднего Running Averages и удерживания максимального значения Max Hold Прецизионный датчик мощности подключается к прибору с помощью стандартного кабеля USB A mini B 3 2000 1498 Функция обнуления позволяет повысить то...

Page 1019: ...главного меню Amplitude 2 Нажмите клавишу подменю Units и выберите необходимую единицу 3 Нажмите клавишу подменю Back для возврата в меню Amplitude Обнуление и калибровка 1 Нажмите клавишу главного меню Zero Cal и нажмите клавишу подменю Cal Factor Введите центральную частоту или нажмите клавишу Signal Standard и с помощью клавиш со стрелками вверх вниз выберите необходимый стандарт Калибровочные ...

Page 1020: ...й 3 Нажмите клавишу подменю Max и с помощью клавиатуры клавиш со стрелками или вращающейся ручки установите вручную максимальное значение аналогового экрана 4 Нажмите клавишу подменю Min и с помощью клавиатуры клавиш со стрелками или вращающейся ручки установите вручную минимальное значение аналогового экрана Примечание При отсутствии смещения максимальное значение для экрана это верхний диапазон ...

Page 1021: ...ся клавиша Relative то падание до 7 дБм отобразится как 3 дБ и 50 Усреднение Max Hold Run Hold 1 Нажмите клавишу главного меню Amplitude 2 Нажмите клавишу подменю Running Averages скользящее среднее С помощью клавиатуры клавиши со стрелками или вращающейся ручки введите необходимое число усреднений 3 Нажмите клавишу подменю Max Hold для включения выключения режима Если выбрано усреднение Averaging...

Page 1022: ...аты удовлетворяют установленным ограничениям или в красный если не удовлетворяют Нажмите клавишу главного меню Amplitude затем нажмите клавишу подменю Units чтобы переключится с дБм на ватты или наоборот Примечание Изображения экранов приводятся в качестве примеров Реальные изображения и информация об измерениях выводимые на экране вашего прибора могут отличаться от примеров приведенных в данном р...

Page 1023: ...следующих разделах дается описание главных меню и связанных с ними подменю Подменю перечисляются в том порядке в котором они появляются на экране сверху вниз под каждым главным меню Рис 3 4 Меню режима прецизионного измерителя мощности 3 6 Шифр 10580 00240 Ред В Измеритель мощности РИ ООО Техэнком Контрольно измерительные приборы и оборудование www tehencom com ...

Page 1024: ...в прибор Во включенном состоянии On в области для сообщений отображается Relative On nnn dB где nnn dB текущее относительное значение При необходимости единицы автоматически переключаются в дБм Units Открывает меню Units dBm или Watt Выбор единицы измерения Выбранная единица отмечается красным кружком Back Возврат в меню Amplitude Autoscale Регулировка верхнего и нижнего значений так чтобы стрелка...

Page 1025: ...мой на датчик выполняет обнуление датчика Данная операция рекомендуется при выполнении измерений мощности ниже 20 дБм Cal Factor Нажатие данной клавиши открывает меню Cal Factor Установите желаемую частоту посредством настройки центральной частоты или использования списка стандарта сигналов Center Freq Для ввода центральной частоты нажмите эту клавишу подменю а затем с помощью клавиатуры клавиш со...

Page 1026: ...ми или вращающейся ручки Если для ввода использовалась клавиатура то нажатие Esc позволяет восстановить предыдущую настройку а нажатие Enter принять новую настройку Рис 3 8 Меню Limit в режиме измерителя мощности 3 9 Меню Sweep Развертка Данное меню не доступно в режиме прецизионного измерителя мощности 3 10 Меню Measure Измерение Данное меню не доступно в режиме прецизионного измерителя мощности ...

Page 1027: ...ООО Техэнком Контрольно измерительные приборы и оборудование www tehencom com ...

Page 1028: ...20 дБм Не превышайте это значение Warning Sensor not zeroed properly The sensor should be zeroed with nothing connected to it Внимание Обнуление датчика выполнено некорректно Обнуление датчика должно выполняться без подключения к нему каких либо устройств Warning Specified temperature range 0 to 50C exceeded The sensor is only specified from 0 to 50C Внимание Превышение температурного диапазона от...

Page 1029: ...А 2 Шифр 10580 00240 Ред В Измеритель мощности РИ ООО Техэнком Контрольно измерительные приборы и оборудование www tehencom com ...

Page 1030: ...т полная информация PSN50 Прецизионный датчик ВЧ мощности 50 МГц 6 ГГц Тип N m 11410 00414 MA24104A Встроенный датчик высокой мощности 600 МГц 4 ГГц Тип N m 11410 00483 MA24106A Прецизионный датчик ВЧ мощности 50 МГц 6 ГГц Тип N m 11410 00424 MA24108A USB датчик СВЧ мощности 10 МГц 8 ГГц Тип N m 11410 00504 MA24118A USB датчик СВЧ мощности 10 МГц 18 ГГц Тип N m 11410 00504 Измеритель мощности РИ Ш...

Page 1031: ...Б 2 Шифр 10580 00240 Ред В Измеритель мощности РИ ООО Техэнком Контрольно измерительные приборы и оборудование www tehencom com ...

Page 1032: ...ичения настройка 2 2 процедура 3 5 относительная мощность настройка 2 2 3 4 описание 3 1 П ПИМ изменение шкалы 3 3 настройка 3 2 обнуление калибровка 3 2 ограничения 3 5 потери рассогласование коррекция с помощью калибровки 3 1 прецизионный измеритель мощности относительная мощность 3 4 удерживание максимума 3 4 прецизионный измеритель мощности усреднение 3 4 С символы безопасности 1 сообщения об ...

Page 1033: ...ООО Техэнком Контрольно измерительные приборы и оборудование www tehencom com ...

Page 1034: ...ООО Техэнком Контрольно измерительные приборы и оборудование www tehencom com ...

Page 1035: ...ООО Техэнком Контрольно измерительные приборы и оборудование www tehencom com ...

Reviews: