YOKOGAWA DLM3022, Руководство пользователя
"YOKOGAWA DLM3022" - мощный осциллограф с двумя каналами и частотой дискретизации 200 МГц. Для полноценного использования прибора важно ознакомиться с руководством пользователя. Скачайте бесплатное руководство на русском языке с manualshive.com. Узнайте все возможности этого устройства для достижения идеальных результатов.
Поделиться
Скачать


Отзывы:
Нет отзывов
Похожие инструкции для DLM3022

S4Cplus
Бренд: ABB Страницы: 86

2200 Series
Бренд: UnionSpecial Страницы: 56
KP312
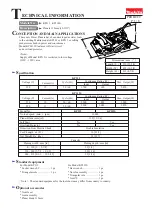
Бренд: Makita Страницы: 8

190
Бренд: VECTECH Страницы: 5

MODENA
Бренд: Panlux Страницы: 2

231
Бренд: dbx Страницы: 2

DHT Series
Бренд: Eagle Group Страницы: 8

BOMAG BW 100 ADM-5
Бренд: Fayat Страницы: 216

MT100
Бренд: B medical systems Страницы: 28

62306
Бренд: Gardigo Страницы: 24

CP2000
Бренд: Gardner Bender Страницы: 8

THERMO-STAR
Бренд: Garantia Страницы: 4

M1-S
Бренд: NARIKA Страницы: 2

HCH
Бренд: SAMCHULLY Страницы: 48

Merryl
Бренд: HAGS Страницы: 5

SPEEDO-CLEAN
Бренд: HAGER WERKEN Страницы: 2

Dual
Бренд: IDS Страницы: 2
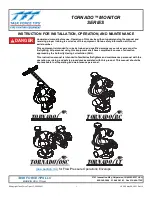
TORNADO
Бренд: Task Force Tips Страницы: 20


