


https://ucore-electronics.com
47
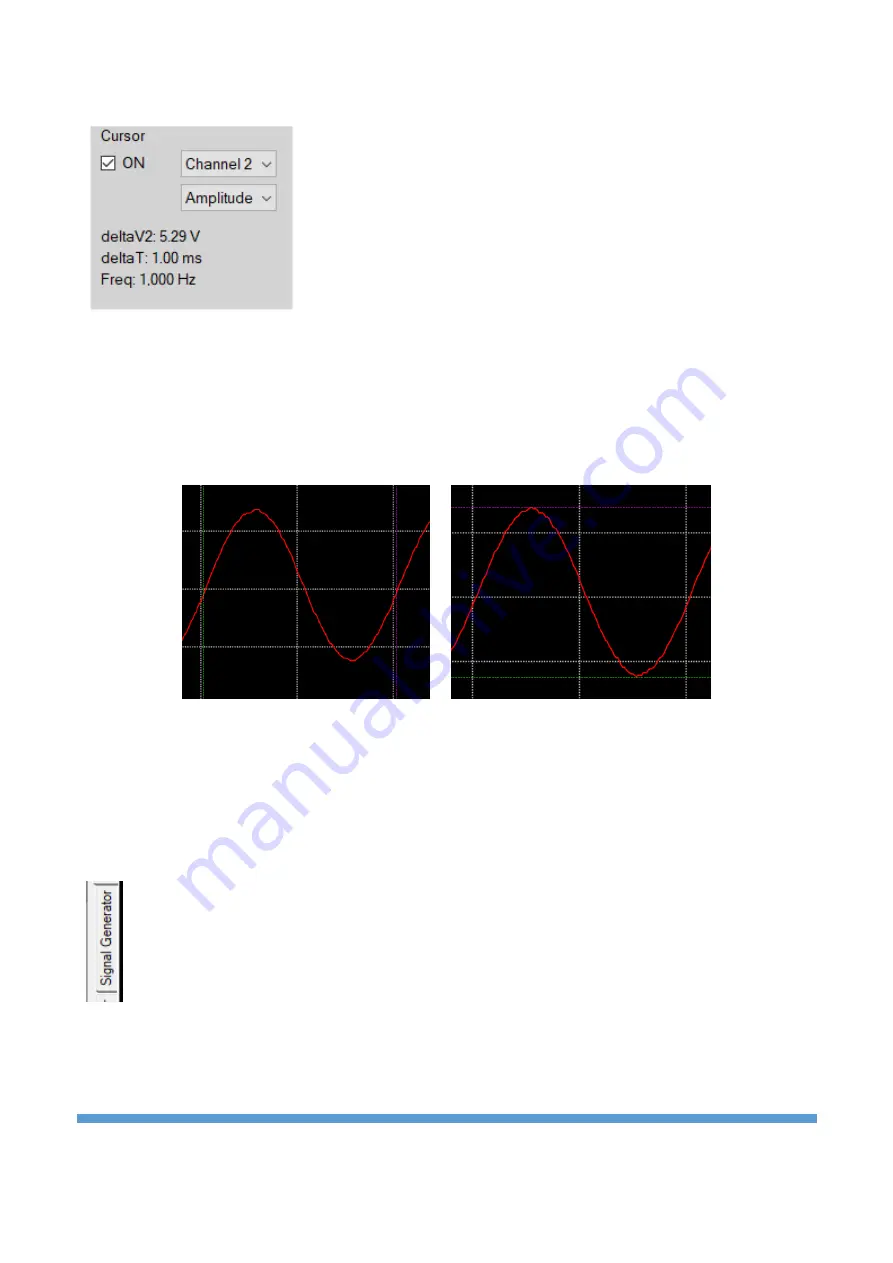
Manual measurement of waveforms is also available in the PC program,
similar to the instrument. The “
ON
” checkbox is marked to activate the
measurement. If it is desired to measure on the Y axis, the second
parameter is selected as
“
Amplitude
”
. In this case, horizontal cursors are
active. The cursors are in two different colors, green and magenta. While
holding down the left button and dragging, the green cursor moves, while
holding down the right button and dragging, the magenta cursor moves
vertically. The voltage difference between the two cursors is seen at the
bottom as
deltaV2
(deltaV1 if measuring for Channel 1). Since CH-1 and
CH-2 may have different volt/div values, the channel where the measurement is made (Channel 1 or
Channel 2) should be selected in the upper parameter. If it is desired to measure in the X axis, the second
parameter is selected as “
Time
” (channel selection does not affec
t). In this case, vertical cursors are
enabled. While dragging with the left button, the green cursor is moved horizontally, while dragging with
the right button, the magenta cursor is moved horizontally. The time difference between the two cursors is
shown below as
deltaT
. The frequency value for this time period is displayed as
Freq
.
X-axis measurement
Y-axis measurement
10.2.
Signal generator
Click the
“
Signal Generator
”
tab on the left to open the signal generator menu. It has an interface that is
very similar to the design on the device. There is a preview of the signal at the top, the signal buttons at the
bottom and the parameter settings at the top right.
General information about the signal generator is explained in Chapter 5.


