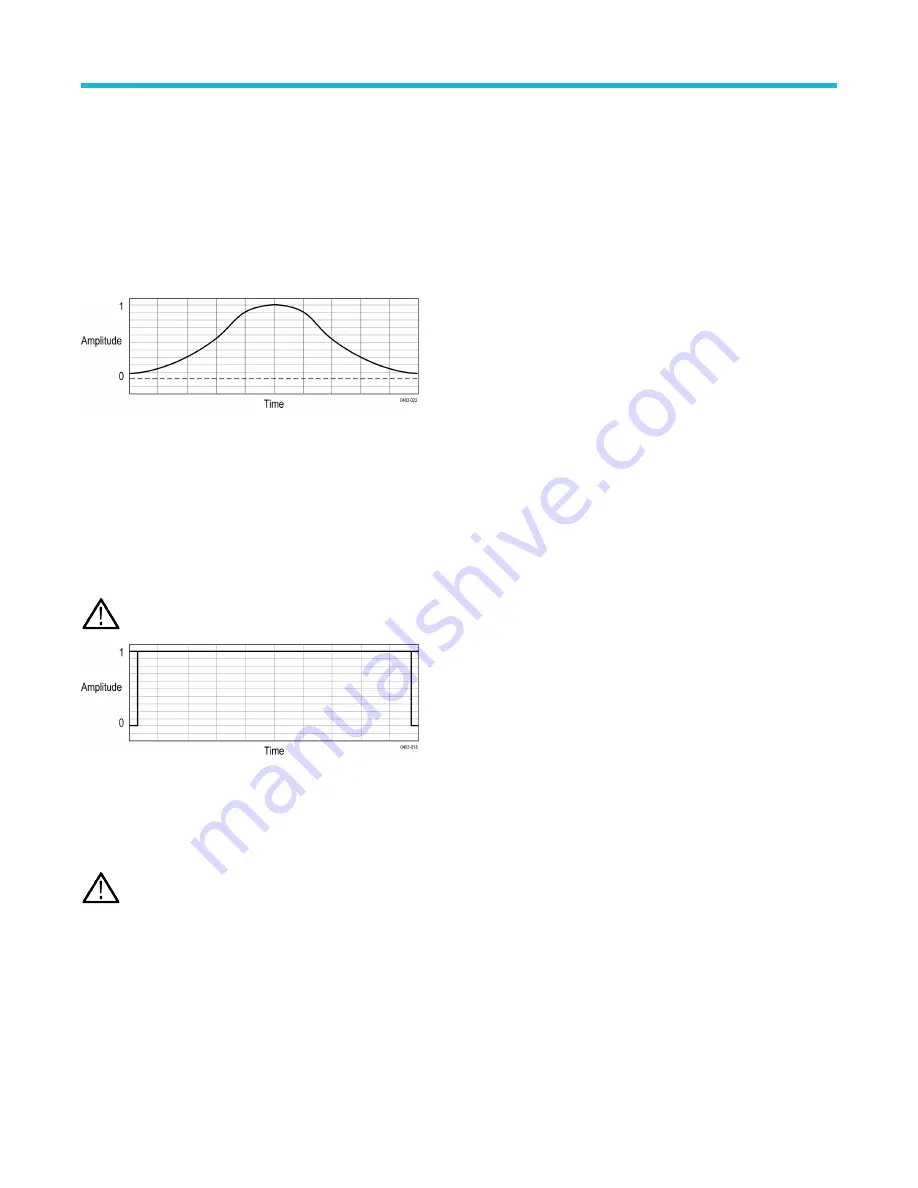
Hamming window
The frequency resolution when using the Hamming window is good (slightly better than Hanning), the spectral leakage is moderate, and
amplitude accuracy is fair.
This window is unique in that the time domain shape does not taper all the way to zero at the ends. This makes it a good choice if you
wanted to process the real and imaginary parts of the spectrum off line and inverse transform it back to the time domain. Because the data
does not taper to zero, you can remove the effect of the window function from the result.
Use the Hamming window for measuring sine, periodic, and narrow band random noise. This window works well on transients or bursts
where the signal levels before and after the event are significantly different.
Rectangular window
The frequency resolution when using the Rectangular window is very good, the spectral leakage is high, and amplitude accuracy is poor.
This window is equal to unity (see the next figure). This means the data samples in the gate are not modified before input to the spectral
analyzer. Rectangular windows are best for measuring transients or bursts where the signal levels before and after the event are nearly
equal. Also, use this window for equal-amplitude sine waves with frequencies that are very close together, and for broadband random
noise with a relatively slow varying spectrum. This window is the best type for measuring the frequency spectrum of non-repetitive signals,
and measuring frequency components near DC.
Note: This window has the narrowest resolution bandwidth of any of the windows, but it also has the most spectral leakage and
the highest side lobes.
Using spectrum math
This topic describes using spectrum math.
The spectrum math feature lets you create a math waveform by adding or subtracting frequency traces.
Note: Spectrum Math is available when the instrument is acquiring in Spectrum Analyzer mode.
1. Tap the Add Math Ref Bus button and then tap Math. This creates a Math badge and displays the math waveform.
2. Double-tap the Math badge to open the Math configuration menu.
3. Set the Source 1 and Source 2 from the drop-down lists.
4. Choose the + or – operators.
The math waveform will appear on the display as a red trace.
5. Double-tap Label and use the keyboard to give your math trace an appropriate label.
Measurement concepts
3 Series Mixed Domain Oscilloscope Printable Help
269


