Front Panel Operation 7
SR620 Universal Time Interval Counter
HARDCOPY OUTPUT
The displayed graph may be copied to either an
Epson compatible graphics printer or a HP-GL
compatible plotter by pressing the "PRINT" key.
The SR620 will continue to take data while the
hardcopy is being generated. If a second print/plot
request is made (by pressing the button or a
programming command) before the current copy is
finished the SR620 will stop taking data until the
current copy is done. This is to avoid corrupting
the second copy as the SR620 only has a 1 deep
graphics output queue.The output device (printer
or plotter) is chosen in the CONFIGURATION
menu (see that section for detail). When using a
printer the SR620 may be put into autoprint mode
by pressing and holding the PRINT key until the
"AUTO" LED turns on. In autoprint mode the
SR620 will automatically print every histogram or a
new stripchart each time the stripchart fills up.
There is no autoprint when using a plotter because
the paper needs to be changed. In autoprint mode
the speed of the printer may determine the
measurement rate if new graphs are generated
faster than the printer can print them. A print or
plot may be aborted by pressing the "CLR" button
under the PRINT button. Pressing and holding the
CLR button will turn off autoprint. If the message
"print error" or "plot error" appears while printing or
plotting please refer to the TROUBLESHOOTING
section.
CHART OUTPUTS
In addition to the scope outputs the SR620 also
has two rear panel analog outputs designed to go
to analog chart recorders. One output puts out a
voltage proportional to the mean of the
measurement while the other output puts out a
voltage proportional the jitter of the measurement.
The output range is 0-8V corresponding to the 8
vertical scope divisions. The scale is the same as
the scope scales. In the cases where zero is at
the center of the scope screen (the REL is set, for
example) zero will correspond to 4 volts output.
The chart outputs may also be configured as
general purpose D/A outputs (see
CONFIGURATION MENU section).
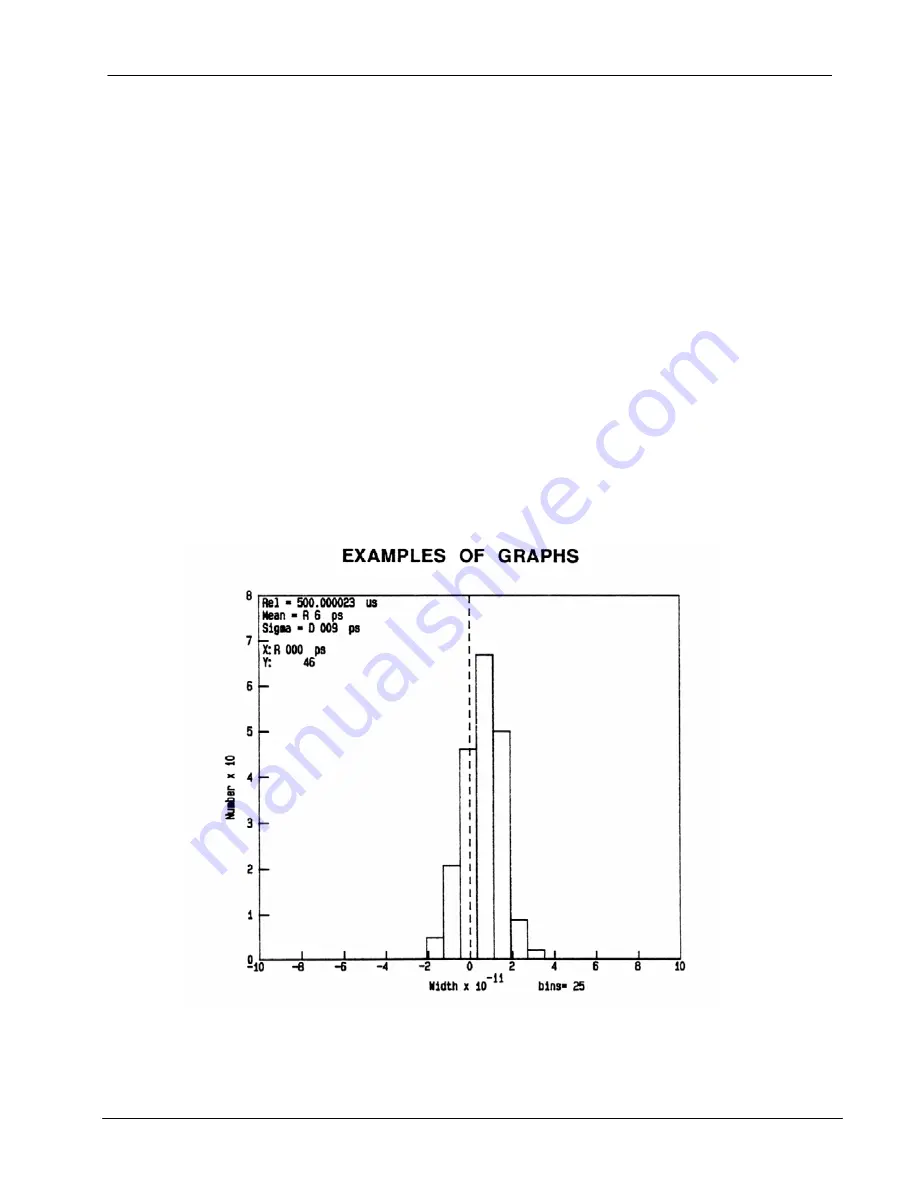
Sample Histogram. The graph scales are 20ps/div in the horizontal direction and 10 /div
in the vertical. The REL is 500.000023 us and is at the center of the graph. This
measurement has a mean value 6ps greater than the REL and a standard deviation of
9ps. The cursor (dotted line) is at the REL and there are 46 events in that bin.
Содержание SR620
Страница 2: ...SR620 Universal Time Interval Counter...
Страница 6: ...iv Table of Contents SR620 Universal Time Interval Counter...
Страница 8: ...vi Safety and Preparation for Use SR620 Universal Time Interval Counter...
Страница 12: ...x Specifications SR620 Universal Time Interval Counter...
Страница 58: ...42 Programming Commands SR620 Universal Time Interval Counter...
Страница 72: ...56 Programming Examples SR620 Universal Time Interval Counter...
Страница 76: ...60 Troubleshooting Tips SR620 Universal Time Interval Counter...
Страница 82: ...66 Performance Test SR620 Universal Time Interval Counter...
Страница 90: ...74 Calibration Procedure SR620 Universal Time Interval Counter...
Страница 102: ...86 Circuit Description SR620 Universal Time Interval Counter...
Страница 124: ...108 Parts List SR620 Universal Time Interval Counter...


