


User Interface DF-760E
87
7.6.4 View Oxygen Data History
Figure 80: Oxygen Data History Menu
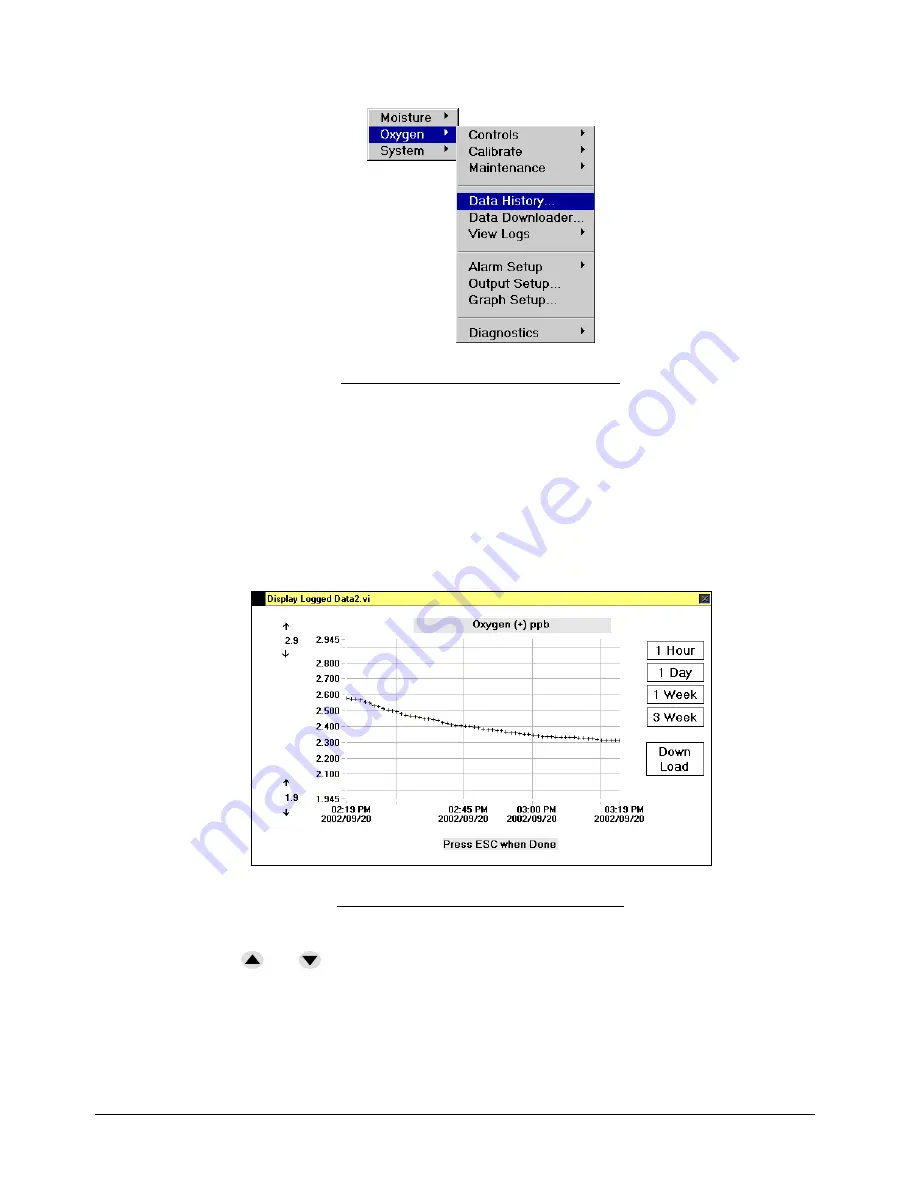
The Data History Screen enables the user to see the data history displayed in strip chart
form on the front display. By default, the data history screen displays data for the most
recent 24 hour period sampled at a rate of 1 point per minute and the y-axis is auto-scaling.
Note, the Data History Screen is also accessed from the Data Downloader screen (Figure
84).
The
Next
button can be used to toggle the X axis scale from 1 day (default), to 1 hour, to 1
week or to 3 weeks.
Figure 81: Oxygen Data History Screen
The
Next
button can also toggle the cursor to the max and min values on the Y axis. The
arrow keys (
and
can then be used to adjust the values, and the display will actively
update.
The data history may be downloaded to a USB memory stick (Flash Drive) by using the
Next
key to move to the
Download
box and hitting
Enter.
A screen will appear, (see
Содержание NanoTrace DF-760E
Страница 1: ...NanoTrace Dual Moisture Oxygen Analyzer DF 760E Instruction Manual...
Страница 4: ......
Страница 38: ......
Страница 44: ......
Страница 122: ......
Страница 128: ......
Страница 138: ......
Страница 142: ......
Страница 143: ...Service DF 760E 139...
Страница 144: ...140 DF 760E...
Страница 148: ......
Страница 166: ......
Страница 168: ......
Страница 171: ...DF 760E 167...
Страница 173: ...Appendix A User Menu Screens DF 760E 169 Page 65 Page 66 Page 67 14 2 Oxygen Menus Page 72 Page 74 Page 86 Page 87...
Страница 174: ...170 DF 760E Appendix A User Menu Screens Page 88 Page 91 Page 93 Page 97 Page 98 Page 99...
Страница 175: ...Appendix A User Menu Screens DF 760E 171 14 3 System Menus Page 102 Page 103 Page 103 Page 106 Page 108 Page 109...
Страница 176: ...172 DF 760E Appendix A User Menu Screens Page 110 Page 111 Page 113 Page 114 Page 115 Page 116...


