Advanced Features
7-1
7.
Advanced Features
In this section:
■
Bar Graph
■
Print Formats
ACCEPT
– –
+ +
–
–
– –
– – –
+
+ + +
✔
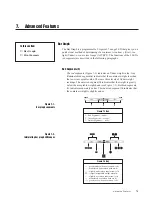
Figure 7-2.
Interpreting bar graph LED ranges
Figure 7-1.
Bar graph segments
✔
Figure 7-2 Key
--- ... greatly under when outer arrow is lit
-- .... moderately under when both are lit
- ...... slightly under when inner arrow is lit
....... (target) acceptable weight when lit
+ ..... slightly over when inner arrow is lit
++ .. moderately over when both are lit
+++ greatly over when outer arrow is lit
Bar Graph
The Bar Graph is a programmable 5-segment, 7-range LED that gives you a
quick visual method of determining if a container is too heavy (Over), too
light (Under), or in a correct range (ACCEPT). The functions of the 5 LEDs
(or segments) are described in the following paragraphs.
Red Segments (2)
The red segments (Figure 7-1) indicates an Under weight value. Any
illuminated red segment(s) indicate that the container weighs less than
the lowest acceptable value. There are three levels of Under weight
readings. The outer red segment lit indicates that the weight is greatly
below the acceptable weight band (see Figure 7-2). Both red segments
lit indicates moderately under. The inner red segment lit indicates that
the container weight is slightly under.
Figure 7-1 Key
1 .. Red Segments — under
2 .. Green Segment — accept
3 .. Amber Segments — over
ACCEPT
1
2
3
UNDER
OVER


