25
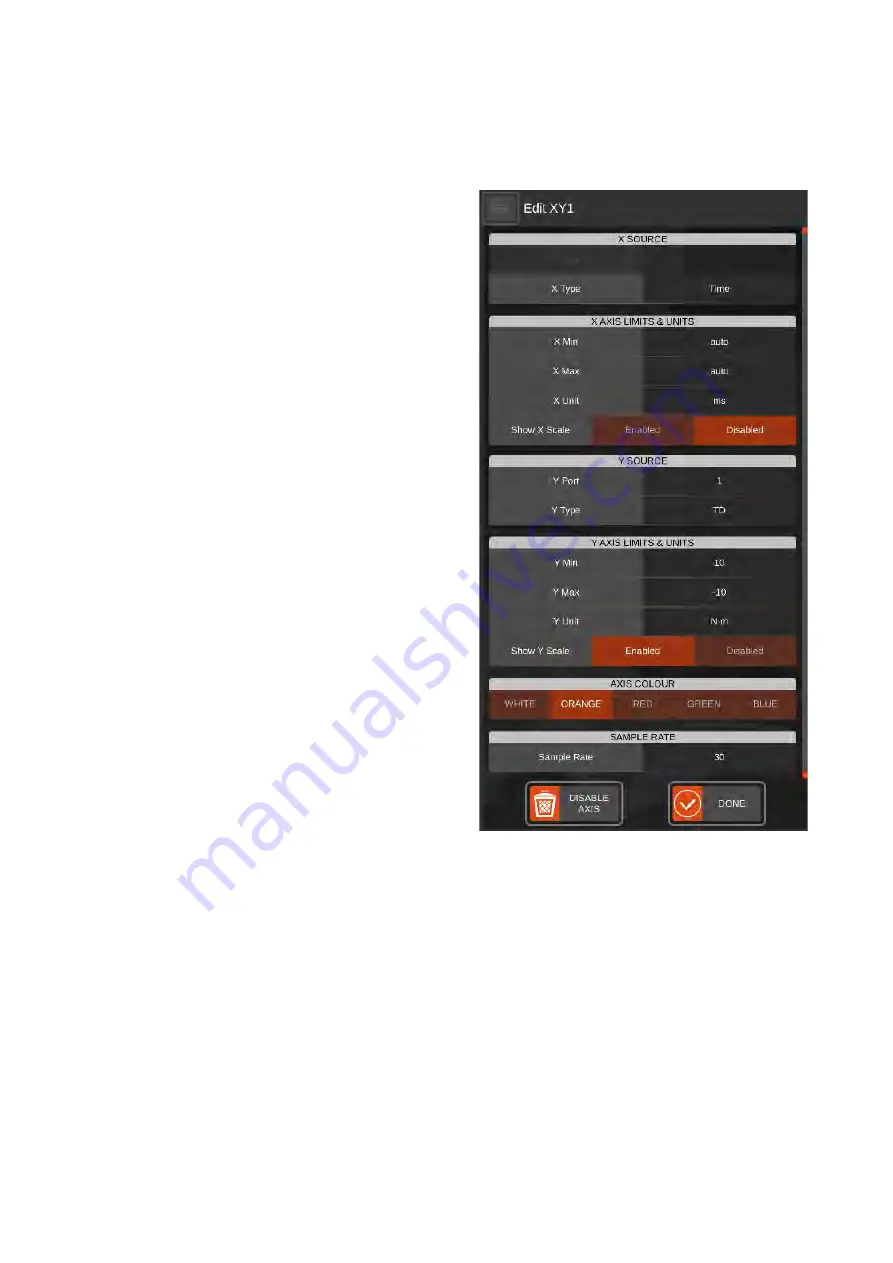
Axis Configurator
There are two X/Y axis pairs per graph, and by default, both will be activated if both AnB ports have a
connected SMART transducer. Use the Axis Configurator to set up or disable an axis pair on a graph.
X/Y Port
Choose the source AnB port from
which to read data
X/Y Type
What type of data to plot (TD value,
Angle, or Time)
X/Y Unit
How to express the reading (locked to
degrees for angle, and ms for time)
Show X/Y Scale
Enable or disable the scale on that
axis of the graph.
X/Y Min/Max
Set the axis scale (auto scale, or
custom value, or TD min/max value
for TD axes)
Axis Colour
Set the colour plotted on the graph
Sample Rate
Change the sample rate (default
30Hz)
Disable Axis
Shuts down axis and removes the plot
line from the graph
Done
Return to Graphing Screen
NOTE:
If an axis data Type is set to “Time” it will
be forced to the same source port as the
other axis in the pair. This is because the
graph can’t plot the time axis of one AnB
port vs the value axis of another.
TIP: The maximum graph capture depth is over
1.17 million samples per axis. This is enough
for continuous capture of between one hour
and two weeks, depending on sample rate.
Choose a sample rate appropriate to the
speed of the measured signal and desired
length of the graph.


