SkyRaider DS10CTEC User Manual
March 17, 2019
SkyRaider DS10CTEC User Manual
Page 85
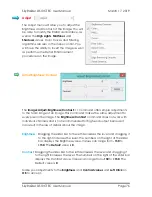
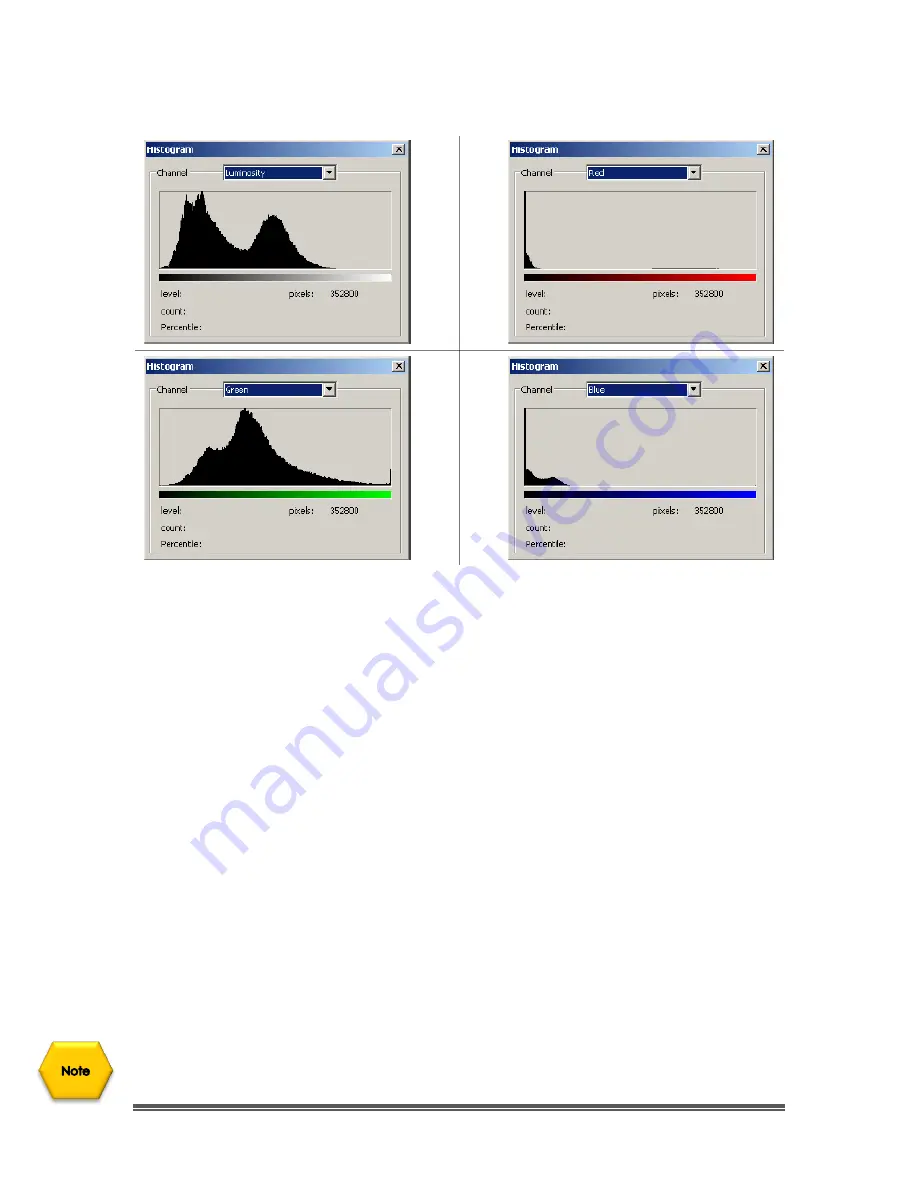
If the image is
RGB true color
, choose
R
,
G
and
B
to display a composite
Histogram of the individual color channels in color.
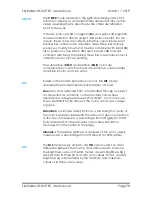
Do one of the following:
➢
To view information about a specific pixel value,
place the mouse pointer
in the Histogram.
➢
To view information about a range of values, click down
the Left-Click
hold and Drag
the mouse into the Histogram to
highlight the range
.
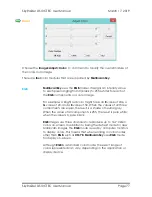
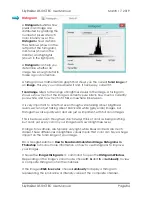
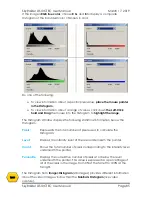
The Histogram Window displays the following statistical information below the
Histogram:
Pixels:
Represents the total number of pixels used to calculate the
Histogram.
Level:
Displays the intensity level of the area underneath the pointer.
Count:
Shows the total number of pixels corresponding to the intensity level
underneath the pointer.
Percentile:
Displays the cumulative number of pixels at or below the level
underneath the pointer. This value is expressed as a percentage of
all of the pixels in the image, from 0% at the far left to 100% at the
far right.
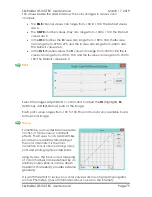
The Histogram from
Image>Histogram
(still images) provides different information
about the video/image window than the
SideBar’s Histogram
(live video
capture).

