81
DL8 USERS
MANUAL EM-7691-B Rev.24
8.5.2 SCREEN COMPONENTS
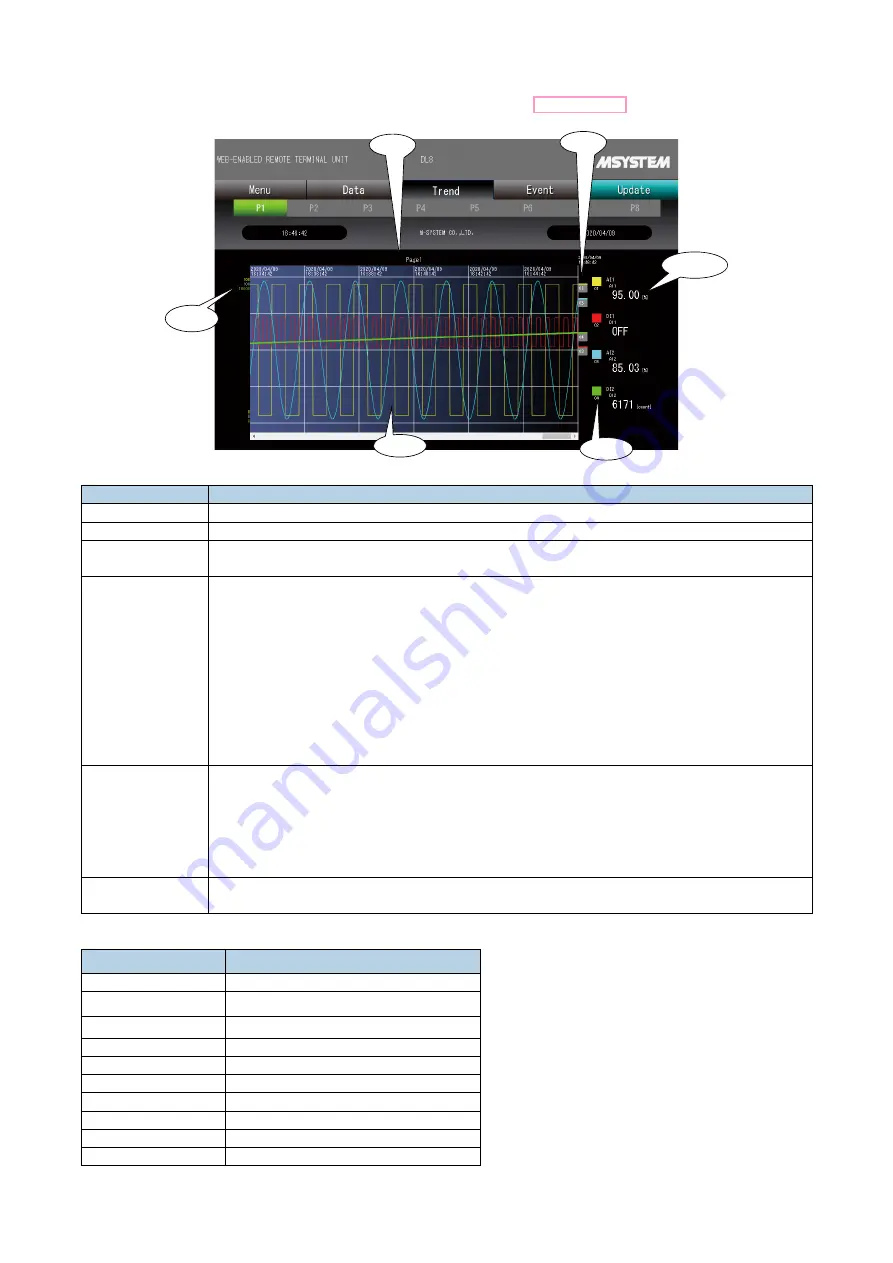
Screen components of a trend page is explained. For configuration, refer to 8.5.3 SETTING.
(1)
(3)
(4)
(2)
(5)
(6)
No.
DESCRIPTION
(1)
Page name
(2)
Up to 4 pens per one page are plotted. Pen color set for each pen is shown by a square indicator.
(3)
The upper/lower limit values (0, 100%) are displayed in each pen color when AI, PI, DI (counter) or
AO is assigned to the pen.
(4)
Plotting area
• Horizontal lines are drawn at 0, 25, 50, 75 and 100 % positions.
• Vertical lines are drawn depending upon the trend speed setting.
*
1
The time stamp is indicated.
• The screen can be scrolled. Max. 720 samples can be plotted in one screen.
Historical trend can be plotted up to 10 screens.
• Graphs are drawn in specified pen colors.
• For AI, PI, DI (counter) or AO, Graphs are drawn within 0 to 100% defined by the upper/lower limit
values described in (3).
For DI and DO, square waves are drawn within each pen’s graph area ruled off by horizontal lines.
(5)
Numerical value display area
• CH name and CH comment assigned to each pen is displayed.
• For AI, PI, DI (counter) or AO, engineering unit value and engineering unit are displayed.
For DI and DO, text corresponding to the status is displayed.
• The display shows value/status at the right end of the chart. When the chart is scrolled, value/
status changes accordingly.
(6)
Pen marks display area
• Pen marks are displayed in respectively set colors.
*
1. The relationship of the time between vertical line to the trend speed is shown in the table below.
TREND SPEED
TIME BETWEEN VERTICAL LINE
1 second
2 minutes
5 seconds
10 minutes
10 seconds
20 minutes
30 seconds
1 hour
1 minute
2 hours
5 minutes
10 hours
10 minutes
1 day
30 minutes
3 days
1 hour
5 days
1 day
120 days


