82
Line 1 of the display shows the current state of the input. HI = 4 - 24 Volts, LO = 0 - 2 Volts.
Line 2 shows the currently selected function of the input. As the voltage on the input changes
so the display will change from HI to LO accordingly. However, whilst using the test function
no action will be taken in response to the input (i.e. the total will not be reset).
NOTE: If the input is disconnected it will read LO.
8.1.6 Viewing temperature
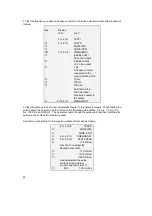
Menu 2.6 allows the current temperature readings to be monitored. These figures are used
internally by software for flow and density compensation.
8.1.7 Viewing primary head signal conditions
Menu 2.7 allows four measured parameters from the primary head to be displayed.
Sensor A, Sensor B (Fct. 2.7.1 and 2.7.2)
These give the normalised sensor signal levels from the primary head. In normal operation
these are controlled so that they both read about 80 - 85%.
If the sensors read less than this it indicates that the vibrations of the primary head are being
impeded. This could be due to a poor installation or a large quantity of air in the process fluid.
Frequency (menu 2.7.3)
This function displays the current resonant frequency of the primary head. This value is
primarily used to calculate the density of the process fluid.
Installation factor (menu 2.7.4)
This factor is a measure of the quality of the primary head's installation. This figure shows
roughly how much energy is required to sustain the oscillations in the primary head. Generally,
the lower the installation factor the better the installation. See Section 4.3 for guidelenes on
installation factor values. In addition, if the process fluid has a large gas content this will have
the effect of damping out primary head oscillation, which will in turn cause the installation
factor to increase.
Key
Display
line 1 line 2
Fct. 2.(5)
TEST INP.E
↑
Fct. 2.(6)
TEST TEMP.
→
20.0
°C
Current temperature °C
↑
68.0
°F
Current temperature °F
↵
Fct. 2.(7)
TEST TEMP.


