Chapter
11: Qualification Reports
Kaye ValProbe RT User Manual
104
11.4. Graph Reports
Graphs reports offer a flexible tool to analyze the data from the raw encrypted Qualification file
and create numerous graph reports.
The Graphs reports and the calculations and Groups they utilize are based on the Sample rate
and other parameters defined in the Setup.
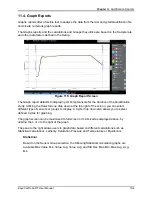
Figure 118: Graph Report Screen
The Graph report defaults to displaying All Temp Sensors for the duration of the Qualification
study. Utilizing the Select Group drop down at the top right of the screen, you can select
different type of sensors or groups to display. A Cycle drop down also allows you to select
defined Cycles for graphing.
The graph screen can be maximized to full screen or minimized as displayed above, by
utilizing the
>
or
<
to the right of the graph.
The pane to the right allows users to graph data based on different calculations such as
Statistical calculations, Lethality, Saturation Pressure and Temperature or Equilibrium.
Statistical
Based on the Sensor Group selection, the following Statistical calculation graphs are
available Max Value, Min Value, Avg Value, Avg and Std Dev, Max-Min, Max-Avg, Avg-
Min.
Содержание ValProbe RT
Страница 1: ...Validation Kaye ValProbe RT User Manual MXXX EN Rev 1 0 May 2020 ...
Страница 2: ... No content intended for this page ...
Страница 4: ... No content intended for this page ...
Страница 12: ......
Страница 147: ...Chapter 11 Qualification Reports Kaye ValProbe RT User Manual 134 No content intended for this page ...
Страница 163: ...Kaye ValProbe RT User Manual 150 ...
Страница 166: ... No content intended for this page ...
Страница 167: ... No content intended for this page ...


