Chapter 8
: Viewing Live Data
Kaye ValProbe RT User Manual
80
8.4. Live Data During Verification
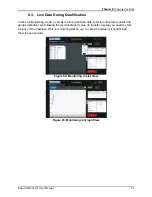
If the ValProbe RT is in Verification, the Verification List/Graph View screen displays a table or
graph for the active verification setpoint sorted by the sensor input. On the right side of the
screen, the set points are marked, when a set point is reached the set point is green. Below
the set points the following is displayed:
Setpoint:
The setpoint Celsius temperature to reach.
Stability Criteria:
An IRTD temperature setpoint in Celsius textbox and a textbox for the length stability,
in minutes, at that setpoint and a textbox for an additional time, in minutes, at stability.
Stability Status:
Time of Stability – a textbox displaying the time of stability when reached.
Stability – displays the current stability data, if red, stability has not been reached, if
green stability has been reached.
Deviation of Stability – displays any deviation during stability in the textbox.
Message – lists any relevant information regarding the setpoint and stabilization.
For a large number of sensors, it may be required to scroll inside the table.
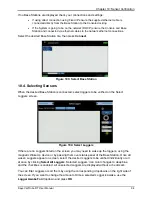
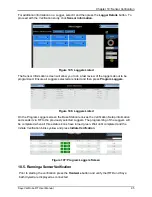
Figure 88: Verification List View Screen
Содержание ValProbe RT
Страница 1: ...Validation Kaye ValProbe RT User Manual MXXX EN Rev 1 0 May 2020 ...
Страница 2: ... No content intended for this page ...
Страница 4: ... No content intended for this page ...
Страница 12: ......
Страница 147: ...Chapter 11 Qualification Reports Kaye ValProbe RT User Manual 134 No content intended for this page ...
Страница 163: ...Kaye ValProbe RT User Manual 150 ...
Страница 166: ... No content intended for this page ...
Страница 167: ... No content intended for this page ...

