M
DSP
DIGITAL
POWER AMPLIFIER
Page
21
/
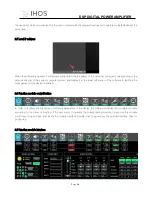
7.4.2 Multi-channel EQ curve display
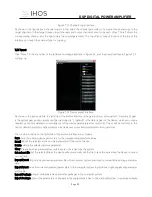
Figure 7.4.1
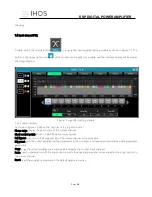
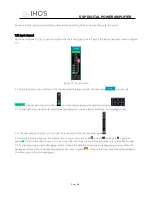
As shown in Figure 7.4.1, on the left is the EQ curve display switch of each channel. When it is turned on, the curve of
the corresponding channel will be drawn in the EQ curve chart.
7.4.3 EQ control
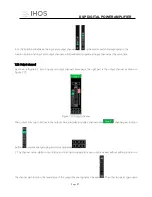
As shown in Figure 7.4.1,
under the curve chart, all EQ controls
and their detailed values are displayed, which can be used to locate the position of the controls. Combined with the
following EQ parameter adjustment items, the parameter value of each EQ can be precisely adjusted.
7.4.4 EQ parameter adjustment item
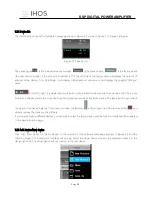
As shown in Figure 7.4.1 above, below the EQ control is the EQ parameter adjustment item, which can precisely control
the EQ switch, type, frequency, Q value, gain and other parameters.
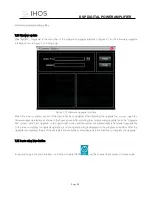
7.4.5 EQ preset button
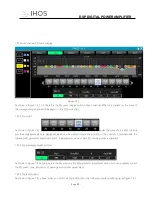
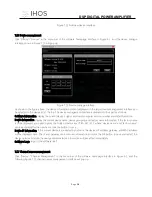
As shown in Figure 7.4.1 above, when you click the EQ preset button, the following interface will pop up as figure 7.4.2.


