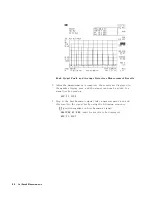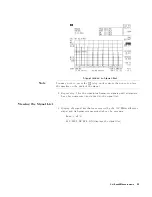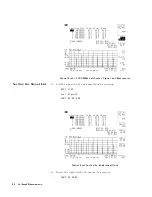
22.
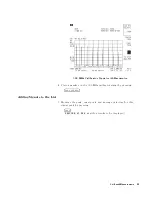
T
o
show
a
logarithmic
graphical
representation
of
the
signals
in
the
signal
list,
press:
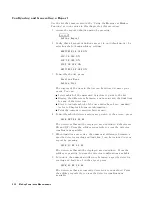
NNNNNNNNNNNNNNNNNNNNNNNNNNNNNNNNNNNNNNNNNNNN
SAVE
LOG
GRAPH
Signals
Plotted
on
Log
Frequency
Scale
Saving
Signal
Lists
Graphs
Note
Signal
list
graphs
can
only
be
saved
to
a
disk.
23.
T
o
save
the
displayed
log
signal
list
graph
to
a
oppy
disk:
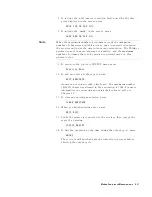
Enter
the
register
number
8
and
press
4
ENTER
5
The
saving
process
takes
several
minutes
.
The
le
on
disk
is
a
Windows
bitmap
(.BMP)
accepted
by
most
Windows
applications
which
read
graphic
images
.
Note
The
\Register
# "
message
is
not
saved
to
the
.BMP
le
.
4-12
List-Based
Measurements
Содержание 85422E
Страница 14: ...7 13 Using 3rd Ord Meas Function 7 19 12 1 External Keyboard Template 12 8 Contents 7 ...
Страница 61: ......
Страница 81: ......
Страница 116: ...Figure 6 25 Using Linearity Check to Identify Distortion Products Making EMI Diagnostic Measurements 6 35 ...
Страница 137: ......
Страница 161: ......
Страница 183: ......
Страница 195: ......
Страница 210: ...If nonrecoverable system errors occur regularly contact your HP representative Error Messages 13 15 ...
Страница 211: ......
Страница 218: ...Customer Support 14 7 ...
Страница 219: ......
Страница 229: ......

