


Heinzinger electronic GmbH
Phone: +49 (0) 8031 2458 0
www.heinzinger.com
Anton-Jakob-Str. 4, 83026 Rosenheim
Fax: + 49 (0) 8031 2458 58
Germany
Page 67
ERS COMPACT
Tapping a button activates or deactivates the feature. Buttons with black on white indicate an activated feature:
Symbol
Belongs to
Meaning
USB logging
USB logging is running (the symbols is only available when
USB logging has been activated in menu “Settings”)
Master-slave
Master-slave activated, device is master
Master-slave
Master-slave activated, device is slave
Master-slave
Master-slave deactivated
Resistance mode
R mode = on
HMI
Alarm sound = on
HMI
Key sound = on
HMI
Opens the graph screen
HMI
Adjust backlight intensity
HMI
Opens the main menu
3.5.10
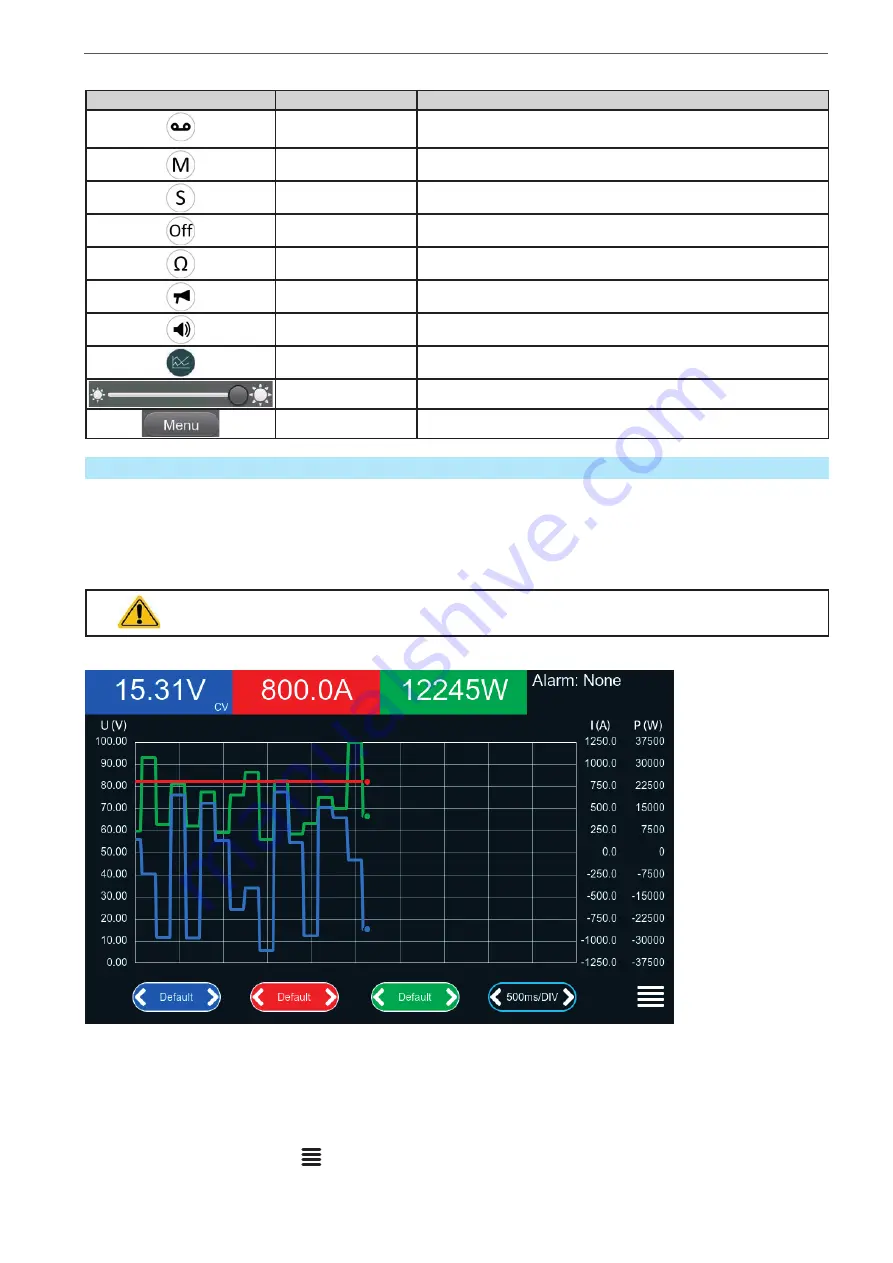
The graph
The devices feature a manually callable, HMI operated visual depiction of the temporal run of the actual values
of voltage, current and power, called the graph. It isn’t a recording feature whatsoever. For data recording in the
background there is still the USB logging feature (see
3.5.8
).
In normal operation the graph can be called anytime via the quick menu, while in function generator operation it’s
called by an extra screen button. Once called, it completely fills the screen.
Limited control options available while the graph is up! For safety reasons it’s, however, possible
to switch off the DC terminal anytime.
Overview:
Controls:
•
Tapping the
middle
of the three red/green/blue touch areas deactivates/activate the corresponding plot
•
Tapping the
sides
(arrows left/right) of the red/green/blue touch areas increases/decreases the vertical scaling
•
Tapping the
sides
(arrows left/right) of the black touch area increases/decreases the horizontal scaling
•
Swiping on the three scales (Y axis) moves them up or down
•
Tapping the menu touch area (
) exits the graph screen anytime