


Heinzinger electronic GmbH
Phone: +49 (0) 8031 2458 0
www.heinzinger.com
Anton-Jakob-Str. 4, 83026 Rosenheim
Fax: + 49 (0) 8031 2458 58
Germany
Page 100
ERS COMPACT
Step 3-1: Load day trend data
If mode
DAY E/T
or
DAY U/I
is selected you are required to
load a curve with day trend data (1-100,000 points) with
Load
day curve from USB
stick, in form of a CSV file with a specific
format (see
3.11.15.5
) and name (see
1.9.6.5
).
There is furthermore the option to enable (=activate) the inter
-
polation feature. For more about interpolation see
3.11.15.6
.
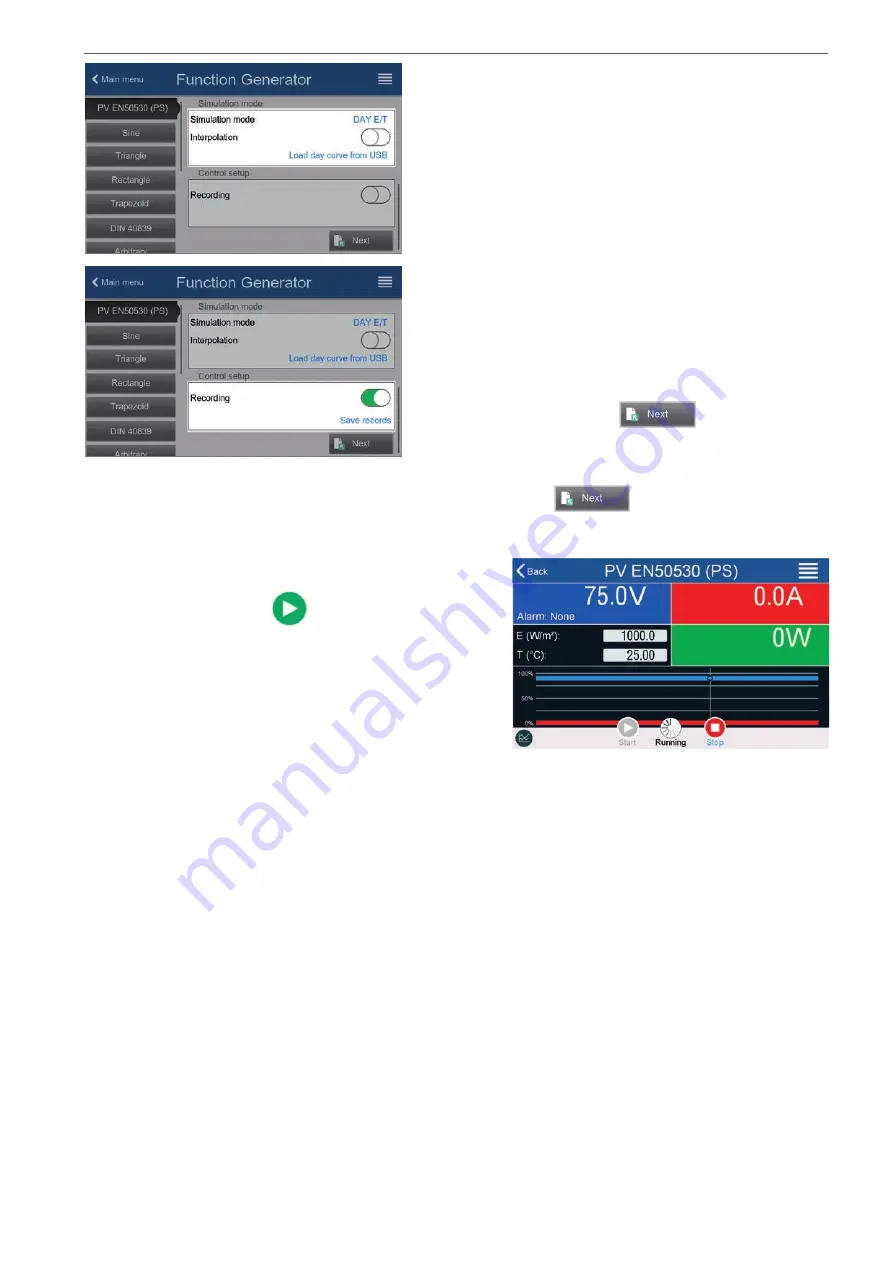
Step 4: Rest
One of the last two steps is the option to enable the recording
feature which collects other data than you would get from the
regular USB recording. The data is not stored directly to USB
stick, but after stopping the simulation and coming back to this
screen with the now available button
Save records
. Also see
3.11.15.7.
Proceed to the next screen with
. Here you can adjust
global set values for voltage and current. These are already set
to levels suitable for the simulation.
The configuration will be finished and the settings submitted with button
. The function generator would
then switch to control mode.
3.11.15.9
Controlling the simulation
After loading the configured parameters the FG will switch to
control mode. Now the simulation can be started with either the
On/Off button or touch area
.
According to the configured simulation mode, the orange-brown
display area would show the adjustable simulation parameters,
which could
only be modified via direct input
, not by the rotary
knobs, because with every step of the knob the curve would
be re-calculated.
The screen example on the right shows simulation mode
E/T
.
In case any of the day trend modes would have been configures, the display area would be empty. These modes
run automatically once started and will stop when the total time of all points’ dwell time is reached. The other modes,
E/T
and
U/I
, would only stop by user interaction or due to a device alarm.
3.11.15.10 Stop criteria
The simulation run could unintentionally stop due to several reasons:
1. A device alarm occurred, which would switch off the DC output (PF, OVP, OCP, OPP)
2. A user event occurred whose action has been defined to cause an alarm, which means to switch off DC
Situation 2 can be avoided by carefully setting up other parameters, unrelated to the function generator. With the
simulation stop in all three situation the data recording would also stop.
3.11.15.11 Test analysis
After simulation stop by whatever reason recorded data can be saved to USB stick or read via digital interface, of
course only of data recording has been activated in the configuration. Activating the data recording feature during
the simulation run is not possible when manually controlling the FG, but in remote control. When saving to USB
stick, it would always save all data recorded until the current index counter. Via digital interface there is the option
read any portion of the data, which will also have an impact on the time required to read the data.
The data can later be used to visualize, analyze and determine characteristics of the simulated solar panel and
also of the solar inverter which is usually used as load when running such tests. More details can be found in the
standard paper.