


Page 63
data sets are desired, then each data set must be exported individually (Single
Time exports).
Which regions of the “Export Metrics” window are active are determined by
selections made within the “Export Metrics” window as well as those Region
and Grouping settings made prior to opening the “Export Metrics” window. For
example, under the Layout heading, Show Each Scan as its Own Table can only
be activated if the Group option was set to “None” during the Graph/Export
Setup.
The Export Metrics window is divided into 3 main sections:
Layout
Destination
Other Options
Each of these sections will be discussed individually.
Layout
Use this section to select the overall Layout of the exported data. The data for
each scan time can be displayed within a single long row or displayed as its own
table.
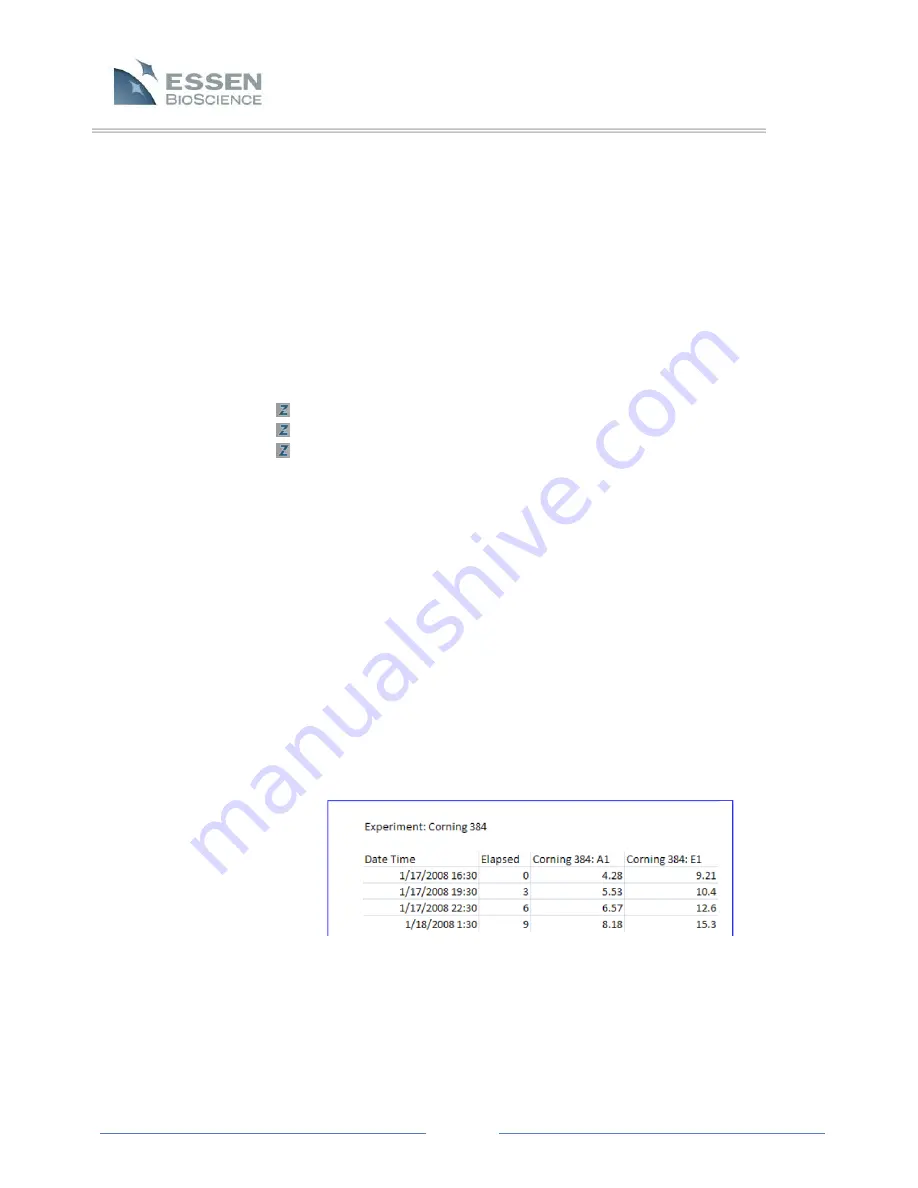
Show Each Scan as a Single Row
In this case, each scan time will be listed to the far left, and the data for each
well will be displayed as a single row to the right. In Figure 22 the data are
displayed as a single row. In this figure, Region: “All Wells”, Group: “None”
were selected prior to opening the Export Metrics window.
NOTE:
Wells from which no data were obtained are omitted.
Figure 22.
Single Row Export


