


Page 54
7.6.1.2 Graph Customization
Initial default labels along with other graph attributes can be personalized. Left-
click twice on the graph background area and the Customization Window will
appear (as shown in Figure 19). This window can be used to set a variety of graph
attributes including graph style, axis, font, etc. Select the various tabs to explore
all available graph-related features.
Title, Subtitle, and individual well/sector names, however, CANNOT be changed
using the Customization window. To assign new labels to wells or sectors, select
the Edit option at the top left of the graph window. This will open the Titles and
Labels window. This window provides an opportunity to change the Title and
Subtitle, as well as the means to assign new well and sector labels. All default or
previously set labels will appear in the Plot Labels box, while the currently
highlighted label will appear below. To change a label, simply highlight the
desired Plot Label with the mouse and then type the new label into the box
underneath. Do not click “OK” until you are ready to close the Titles and Labels
window. Clicking on the Advance button will bring up the Customization window.
The Customization Window can also be accessed by double left-clicking on the
graph.
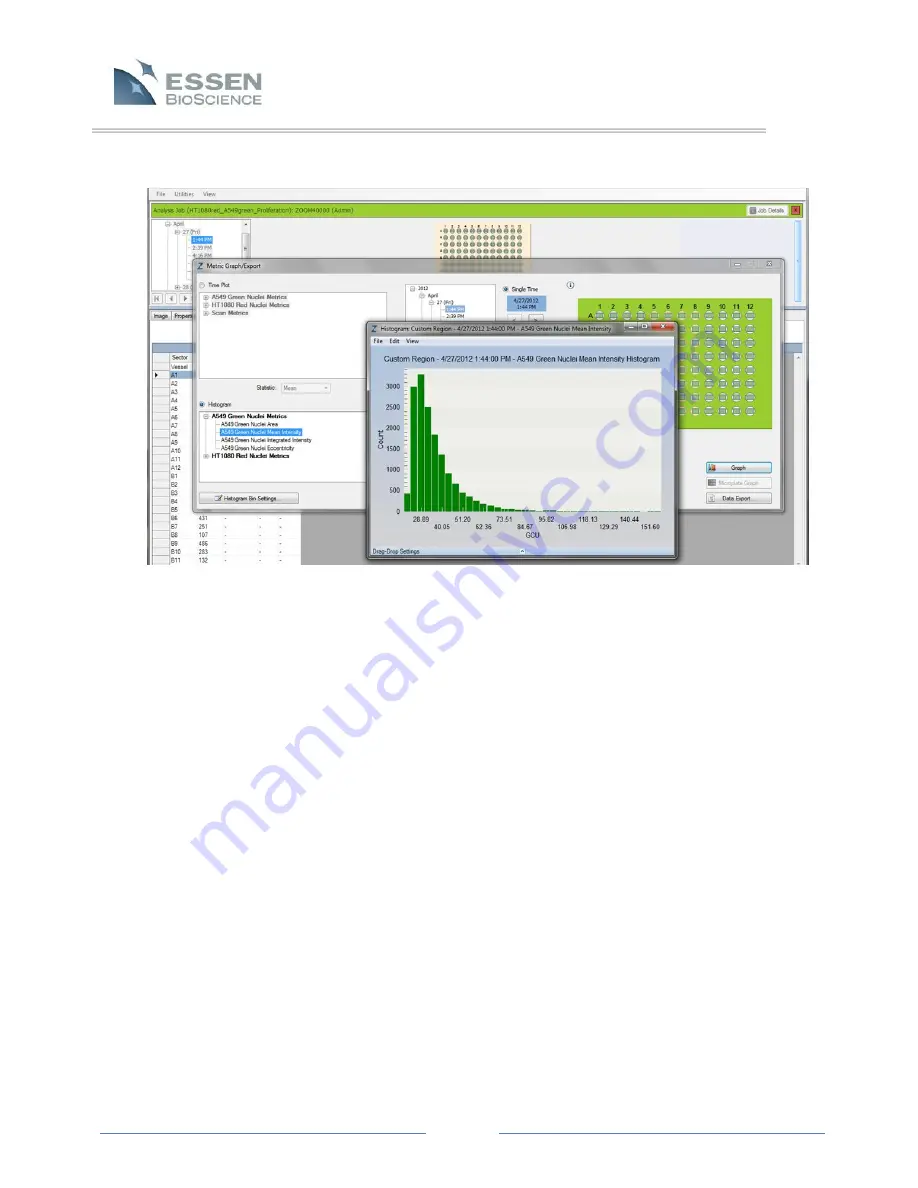
Figure 20.
Histogram


