308
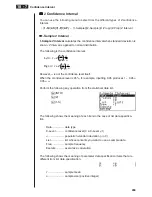
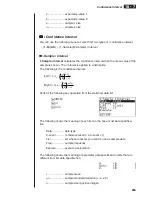
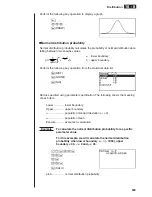
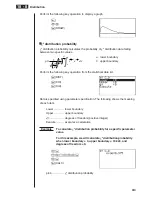
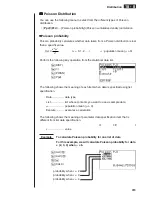
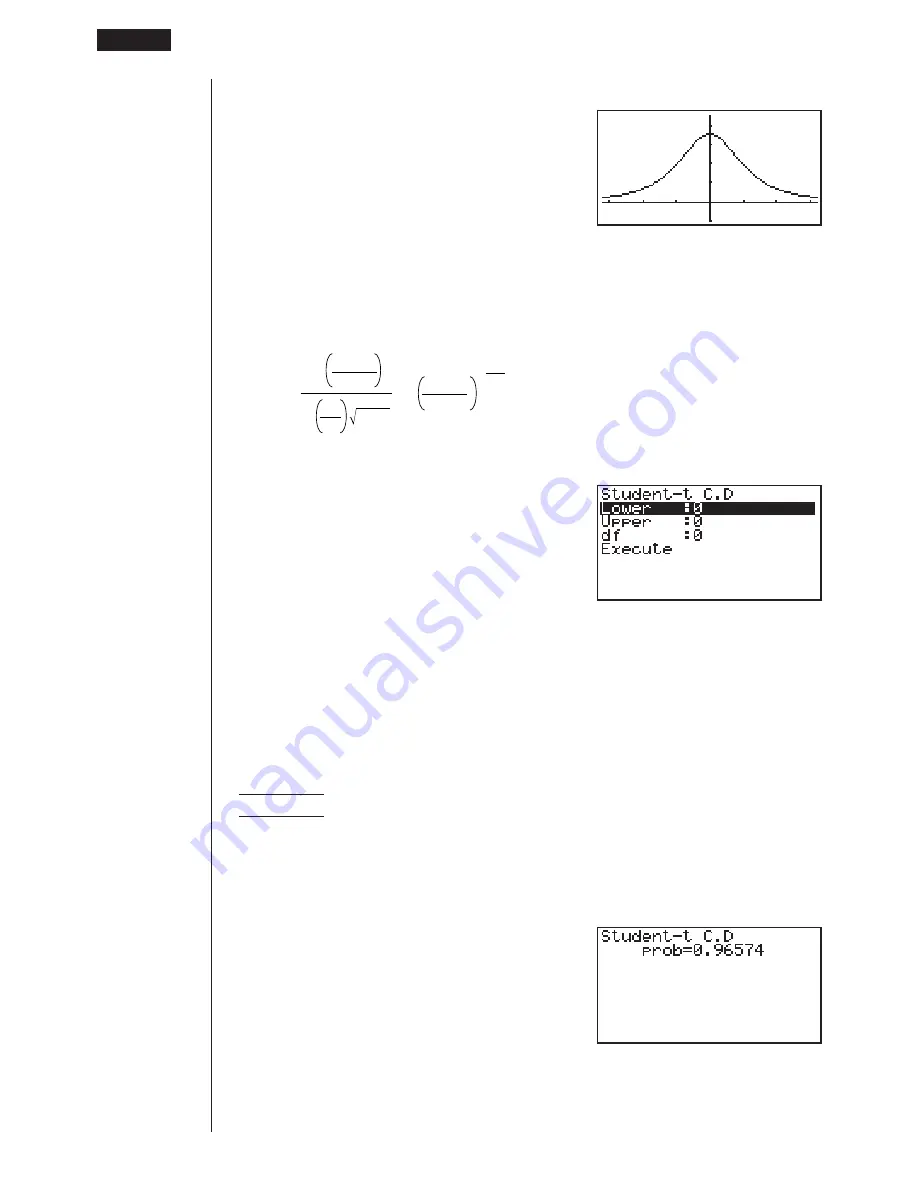
Perform the following key operation to display a graph.
J
cc
6
(DRAW)
u
u
u
u
u
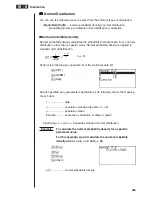
Student-
t
distribution probability
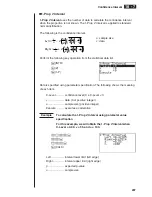
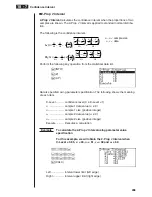
Student-
t
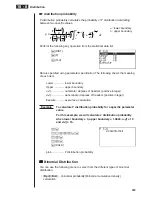
distribution probability calculates the probability of
t
distribution data
falling between two specific values.
p
=
-
-
df
$
2
df
2
df
+ 1
–
df
+1
2
df
1 +
x
2
dx
a
b
*
a
: lower boundary
b
: upper boundary
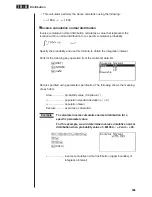
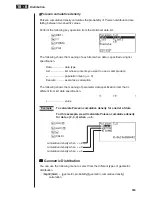
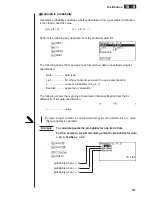
Perform the following key operation from the statistical data list.
5
(DIST)
2
(
t
)
2
(tcd)
Data is specified using parameter specification. The following shows the meaning
of each item.
Lower ............. lower boundary
Upper ............. upper boundary
df
.................... degrees of freedom (
df
>
1)
Execute .......... executes a calculation
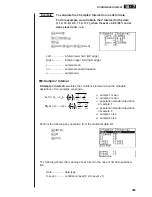
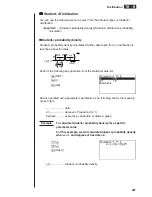
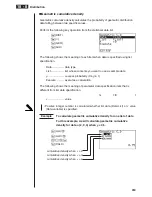
Example
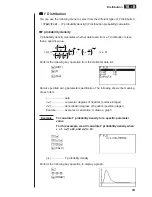
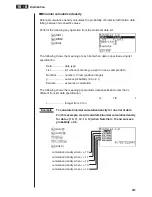
To calculate Student-
t
distribution probability for a specific
parameter value
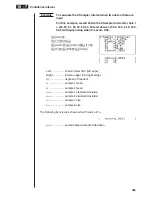
For this example, we will calculate Student-
t
distribution
probability when lower boundary = –2, upper boundary = 3, and
degrees of freedom = 18.
-
c
w
d
w
bi
w
1
(CALC)
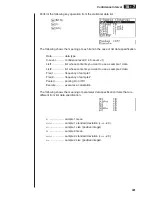
prob ................ Student-
t
distribution probability
18 - 8
Distribution
Содержание CFX-9970G
Страница 22: ... CFX 9970G ...
Страница 62: ...Manual Calculations 2 1 Basic Calculations 2 2 Special Functions 2 3 Function Calculations Chapter 2 ...
Страница 452: ...435 1 2 3 4 5 Program for Circle and Tangents No 4 Step Key Operation Display ...
Страница 453: ...436 Program for Circle and Tangents No 4 Step Key Operation Display 6 7 8 9 10 ...
Страница 454: ...437 11 12 13 14 15 Program for Circle and Tangents No 4 Step Key Operation Display ...
Страница 455: ...438 16 17 18 Program for Circle and Tangents No 4 Step Key Operation Display ...
Страница 458: ...441 1 2 3 4 5 Program for Rotating a Figure No 5 Step Key Operation Display ...

