289
!
2
....................
!
2
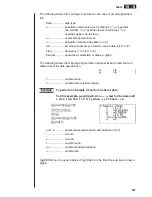
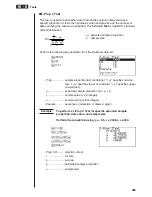
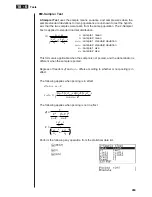
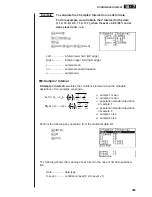
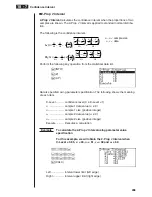
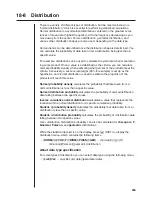
value
p
..................... p-value
df
.................... degrees of freedom
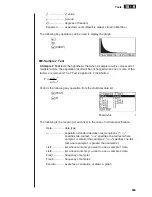
Expected ........ expected counts (Result is always stored in MatAns.)
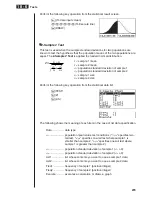
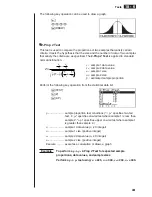
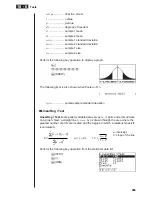
The following key operation can be used to display the graph.
J
c
6
(DRAW)
u
u
u
u
u
2-Sample
F
Test
2-Sample
F
Test
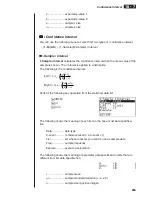
tests the hypothesis that when a sample result is composed of
multiple factors, the population result will be unchanged when one or some of the
factors are removed. The
F
Test is applied to
F
distribution.
F
=
x
1
n
–1
2
%
x
2
n
–1
2
%
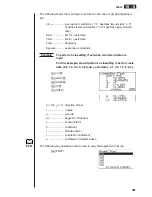
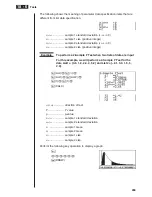
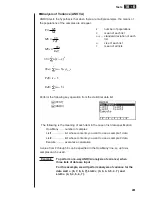
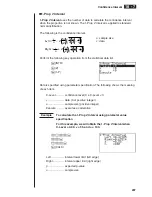
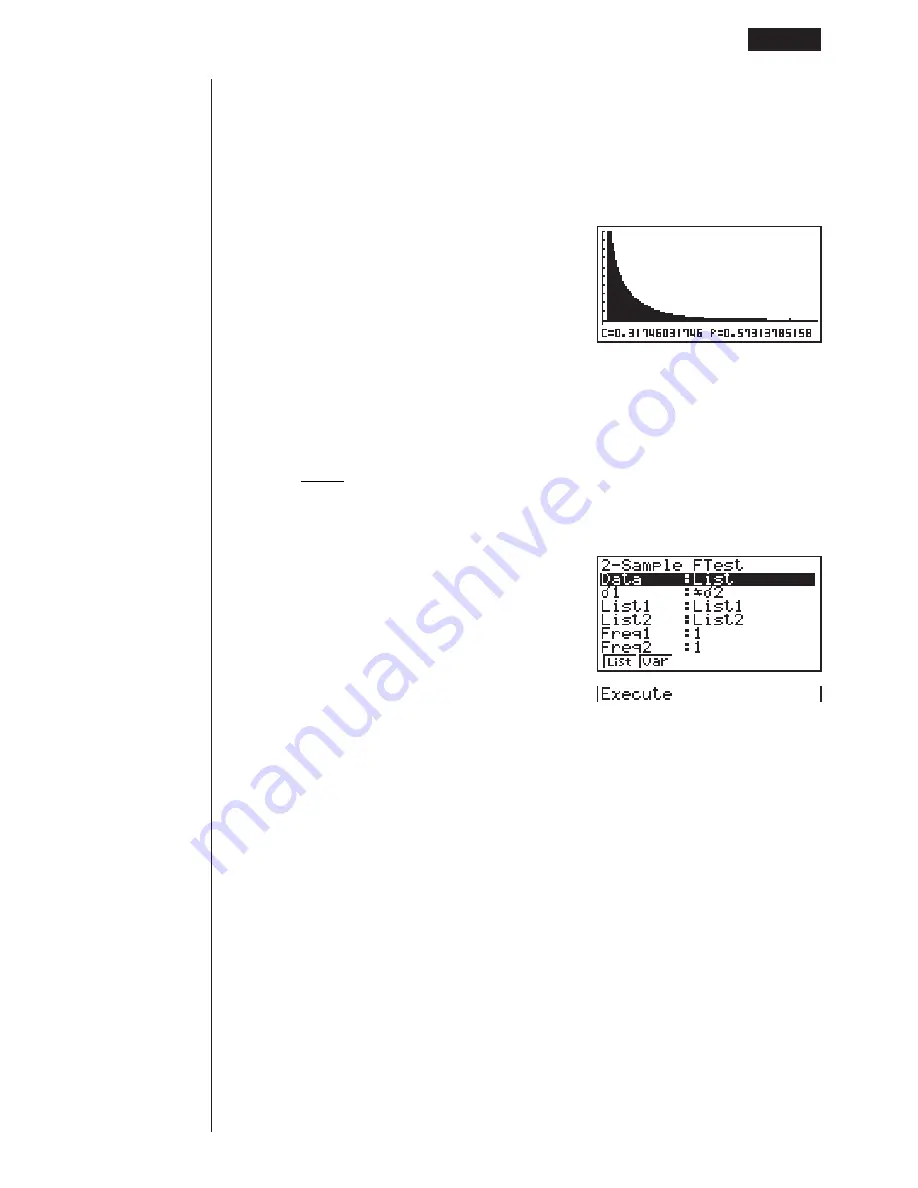
Perform the following key operation from the statistical data list.
3
(TEST)
4
(F)
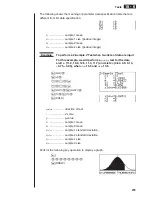
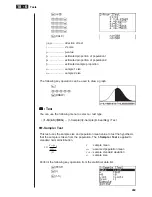
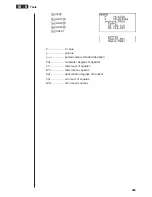
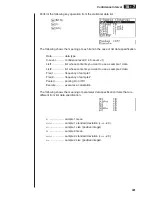
The following is the meaning of each item in the case of list data specification.
Data ................ data type
%
1
.................... population standard deviation test conditions (“
G
%
2
”
specifies two-tail test, “<
%
2
” specifies one-tail test where
sample 1 is smaller than sample 2, “>
%
2
” specifies one-tail
test where sample 1 is greater than sample 2.)
List1 ................ list whose contents you want to use as sample 1 data
List2 ................ list whose contents you want to use as sample 2 data
Freq1 .............. frequency of sample 1
Freq2 .............. frequency of sample 2
Execute .......... executes a calculation or draws a graph
Tests
18 - 6
Содержание CFX-9970G
Страница 22: ... CFX 9970G ...
Страница 62: ...Manual Calculations 2 1 Basic Calculations 2 2 Special Functions 2 3 Function Calculations Chapter 2 ...
Страница 452: ...435 1 2 3 4 5 Program for Circle and Tangents No 4 Step Key Operation Display ...
Страница 453: ...436 Program for Circle and Tangents No 4 Step Key Operation Display 6 7 8 9 10 ...
Страница 454: ...437 11 12 13 14 15 Program for Circle and Tangents No 4 Step Key Operation Display ...
Страница 455: ...438 16 17 18 Program for Circle and Tangents No 4 Step Key Operation Display ...
Страница 458: ...441 1 2 3 4 5 Program for Rotating a Figure No 5 Step Key Operation Display ...

