127
u
u
u
u
u
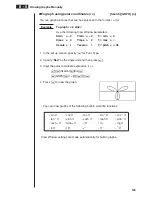
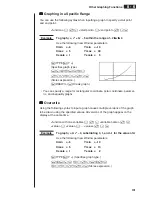
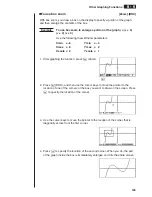
To draw an integration graph
[Sketch]
-
[GRPH]
-
[G
%
dx]
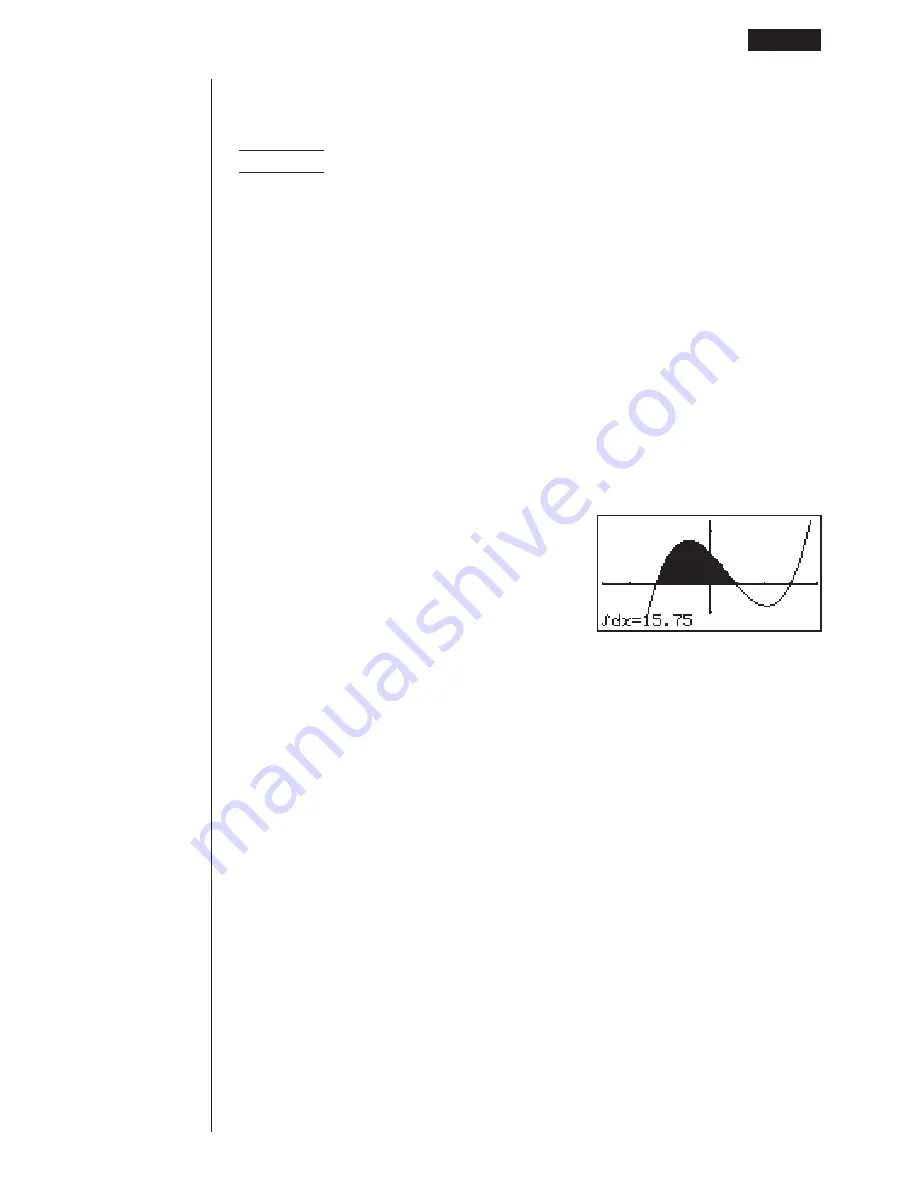
You can graph an integration calculation performed using the function
y
=
f
(
x
).
Example
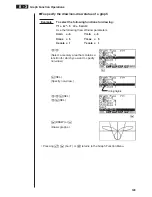
To graph the following, with a tolerance of “tol” = 1
E
- 4:
%
–2
1
(
x
+ 2) (
x
– 1) (
x
– 3)
dx
Use the following View Window parameters.
Xmin
= –4
Ymin
= –8
Xmax = 4
Ymax = 12
Xscale = 1
Yscale = 5
1. In the set up screen, specify “
Y=
” for Func Type and then press
J
.
2. Input the integration graph expression.
!4
(Sketch)
1
(Cls)
w
5
(GRPH)
5
(G
%
dx
)
(
v
+c)(
v
-b)
(
v
-d),
-
c,b,b
E-
e
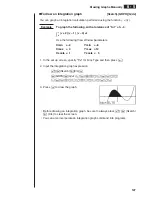
3. Press
w
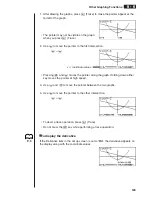
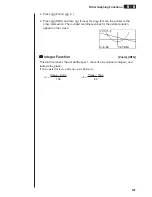
to draw the graph.
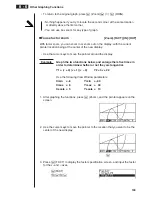
• Before drawing an integration graph, be sure to always press
!
4
(Sketch)
1
(Cls) to clear the screen.
• You can also incorporate an integration graph command into programs.
Drawing Graphs Manually
8 - 5
Содержание CFX-9970G
Страница 22: ... CFX 9970G ...
Страница 62: ...Manual Calculations 2 1 Basic Calculations 2 2 Special Functions 2 3 Function Calculations Chapter 2 ...
Страница 452: ...435 1 2 3 4 5 Program for Circle and Tangents No 4 Step Key Operation Display ...
Страница 453: ...436 Program for Circle and Tangents No 4 Step Key Operation Display 6 7 8 9 10 ...
Страница 454: ...437 11 12 13 14 15 Program for Circle and Tangents No 4 Step Key Operation Display ...
Страница 455: ...438 16 17 18 Program for Circle and Tangents No 4 Step Key Operation Display ...
Страница 458: ...441 1 2 3 4 5 Program for Rotating a Figure No 5 Step Key Operation Display ...

