


Rev 1.0
39
9.3.2.3
vertical bar
The vertical bar is a vertical bar chart and can be used wonderfully to display and compare
temperatures or pressures. This is freely configurable in both size and color. A gradient is also
possible.
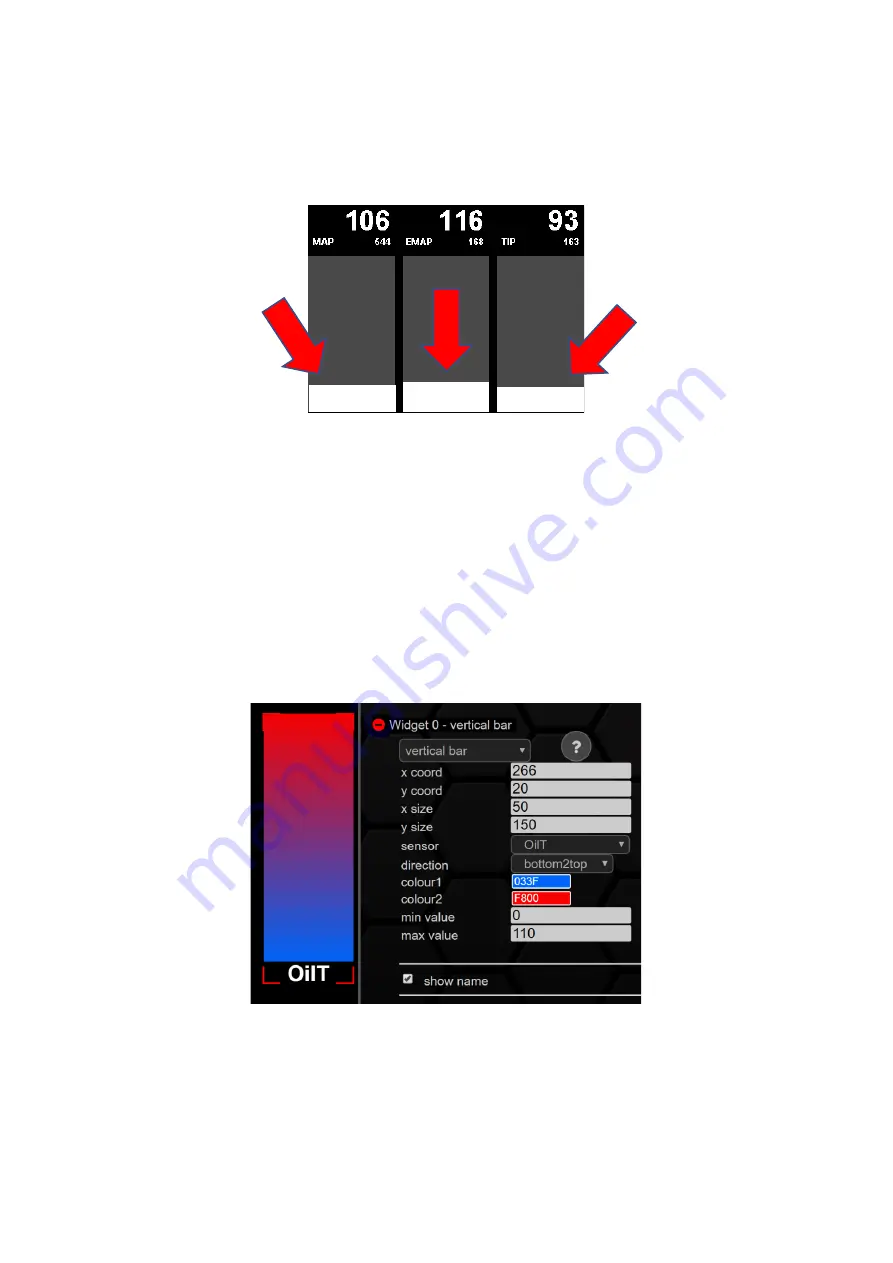
Figure 31: Display view of the vertical bar widget for comparing three pressures
When it comes to the course of the
vertical bar
, you can choose from three options:
•
Ascending from bottom to top (
bottom2top
)
•
Falling from top to bottom (
top2bottom
)
•
Horizontal line as pointer (
bar
)
Furthermore, a colour for the lower values and a colour for the upper values can be defined. For
optimal design of the display area, the lower or upper limit of the
vertical bar
can be set at
min
value
and
max value
. If these limits are set to 0, the values of the corresponding
sensor
from the
TRI/TRX
file
are used.
Figure 32: Configuration vertical bar
In the previous example, the sensor was assigned
to OilT
. Thus, the
vertical bar
is blue first and then
turns red with increasing oil temperature.
If the check mark is set at
show
name, the name of the assigned
sensor
is displayed in the lower area
of the
vertical bar
.
Содержание MFD28 Gen2
Страница 1: ...MFD28 32 Gen2 Manual...


